Signed in as:
filler@godaddy.com
I took the 23nMe DNA test in the summer of 2021, For me, this was the last thing i could do to dispel anyone accusing us of fraud, also having done quite alot of genealogy on my fathers side, i was really curious about my mothers links to nobility. This year has been a mix of working on both of their ancestries, finding new links between the family lines, seriously how inbred can someone be??
I have royal bloodlines from my mothers side with both of her parents having royalty within their seperate families, As i do with my father, from myself i have more than 6 lines that go back to royalty.
My Dna confirms this.
People can easily lie about their genealogy, I have seen many pretenders over the years and feel sorry for the want and need to be valued within our family and the Royal Dragon Court, at the same time how do we know the royals at the time did not fudge said ancestry such as Alfred the Great, This is why i never insist on my genealogy dating back to Jesus or Odin as I use facts, records and logic. As much as we read the bible and have studies many different religions, Some of the bible does not give accurate accounts as it was rewriten by the jews, much of what we see in the world is propagander and confirmation biased. Seek and ye shall find. On the other hand I'm grateful enough that many many people have written thousands of books and pieces of history about my grandparents, its very comforting to have the history of the world, family as creators and kings running through my veins.
So the results came back and i found it so funny, very basic and not what i expected, To find out that i am Jewish on both my mother and fathers side was pretty amazing but it should have been expected as the bloodline of the Dragons are of Scythian descent.
Population Match Confidence Percent Northwestern European 99.7% Percent Northwestern European ancestry: 99.7. British & Irish 99.7% Percent British & Irish ancestry: 99.7. Match Confidence level for United Kingdom: Highly Likely Match United Kingdom Highly Likely Match level for Ireland: Highly Likely Match Ireland Highly Likely Match . Ashkenazi Jewish 0.3% Percent Ashkenazi Jewish ancestry: 0.3. E
Abbe, your maternal haplogroup is T1b. As our ancestors ventured out of eastern Africa, they branched off in diverse groups that crossed and recrossed the globe over tens of thousands of years. Some of their migrations can be traced through haplogroups, families of lineages that descend from a common ancestor. Your maternal haplogroup can reveal the path followed by the women of your maternal line. Migrations of Your Maternal Line
Haplogroup L 180,000 Years Ago If every person living today could trace his or her maternal line back over thousands of generations, all of our lines would meet at a single woman who lived in eastern Africa between 150,000 and 200,000 years ago. Though she was one of perhaps thousands of women alive at the time, only the diverse branches of her haplogroup have survived to today. The story of your maternal line begins with her. T1 16,500 Years Ago Origin and Migrations of Haplogroup T1 Haplogroup T originated in the Middle East about 45,000 years ago, not long after humans emerged from Africa. The haplogroup mostly stayed in place until about 15,000 years ago, when the glaciers that had covered much of Eurasia during the Ice Age began to retreat. As Europe's climate warmed and its long-frozen landscape turned green, people began moving north into the Alps and beyond. Your maternal line stems from the T1 branch of T. All the members of T1 trace their maternal lines back to a woman who lived about 16,500 years ago, when members of haplogroup T were still confined to the Middle East. After the development of agriculture in the region some people began traveling westward, bringing their crops and livestock to Europe about 9,000 years ago. Some of these people were women who belonged to T1, and today their descendants can be found from Britain in the west to Turkey and Syria in the east. T1b 6,000 Years Ago Your maternal haplogroup, T1b, traces back to a woman who lived approximately 6,000 years ago. That's nearly 240 generations ago! What happened between then and now? As researchers and citizen scientists discover more about your haplogroup, new details may be added to the story of your maternal line. T1b Today T1b is relatively uncommon among 23andMe customers. Today, you share your haplogroup with all the maternal-line descendants of the common ancestor of T1b, including other 23andMe customers. 1 in 1,500 23andMe customers share your haplogroup assignment.
My Fathers Marker is R1B1A.
I uploaded my raw data to my true ancestry and the results showed that I am related to every royal family throughout history, knowing that my ines has intertwined many times with my father and mother we started to question whether the dragon bloodline holds certain traits.
We have many times spoken about the gifts and magical abilities we have, is this something that only the dragon dna holds? What is the dna marker for our bloodline as many share variations that also match ours. Lol who was the first dragon? again we have discussed that it came from Egypt, but as with the jesus bloodline theory, how many of us can truely insist that the research we have done is correct and not in a biased way in order to find the conclusion that you want?, this goes with most theories, statistics and recording of data. as with the out of Africa theory or the works by sitchen and others that has been debunked.
Grand Princes of Kiev Z1a - Roman the Great (1152-1205) Grand Dukes of Lithuania Russian Royalty H3 - Peter II (1715-1730) Romanovs T2 - Nicholas II (1868-1918) H - Maria Feodorovna (1847-1928) H - Alexandra Feodorovna (1872-1918) Greek Royalty T2 - George I (1845-1913)
H - Sophia of Prussia (1870-1932) H - Princess Alice of Battenberg (1885-1969) H - Alexander (1893-1920) H - George II (1890-1947) H - Paul (1901-1964) H - Anne-Marie (1946-) H - Pavlos, Crown Prince of Greece (1967-) Romanian Royalty H - Ferdinand I (1865-1927) H - Michael (1921-) Bulgarian Royalty Polish Royalty H - Boleslaw I Chrobry (967-1025) H - Catherine of Austria (1533-1572) H - Anna of Austria (1573-1598) H - Wladyslaw IV Vasa (1595-1648) H - Constance of Austria (1588-1631) H - John II Casimir Vasa (1609-1672) H - Eleonora Maria Josefa of Austria (1653-1697)
T2 - Elisabeth of Austria (1436-1505) T2 - John I Albert (1459-1501) T2 - Alexander Jagiellon (1461-1506) T2 - Sigismund I of Poland (1467-1548)
N1b - Marie Louise Gonzaga (1611-1667) N1b - Marie Therese de Bourbon (1666-1732)
House of Grimaldi Portuguese Royalty H - Maria II (1819-1853) H - Pedro V (1837-1861) H - Luis I (1838-1889) Spanish Royalty U5b - Philip I of Castile (1478-1506) H - Margaret of Austria (1584-1611) H - Philip IV (1605-1665) H - Elisabeth of France (1602-1644) H - Mariana of Austria (1634-1696) H - Charles II (1661-1700) H - Marie Louise of Orleans (1662-1689) H - Maria Luisa of Savoy (1688-1714) H - Ferdinand VI (1713-1759) H - Isabella II (1830-1904) H - Alfonso XII (1857-1885) H - Victoria Eugenie of Battenberg (1887-1969) H - Sofia (1938-) H - Felipe,
Prince of Asturias (1968-) N1b - Maria Amalia of Saxony (1724-1760) N1b -
Charles IV of Spain (1748-1819) H3 - Maria Josepha of Saxony (1803-1829) Sardinian Royalty H - Charles Emmanuel III of Sardinia (1701-1773) H3 - Marie Christina of the Two Sicilies (1779-1849) H3 - Maria Theresa of Tuscany (1801-1855) Dukes of Parma Italian Royalty H3 - Victor Emmanuel II (1820-1878) Grand Duke of Tuscany H - Archduchess Joanna of Austria (1547-1578) H - Ferdinando II de' Medici (1610-1670)
French Royalty Z1a - Ingeborg of Denmark, Queen of France (1175-1236) U5b - Francis I (1494-1547) U5b - Henry IV (1553-1610) H - Marie de' Medici (1575-1642) H - Louis XIII (1601-1643) H - Maria Theresa of Spain (1638-1683) H - Louis, Dauphin of France (1661-1711) H - Louis XV (1710-1774)
N1b - Louis XVI (1754-1793) N1b - Louis XVIII of France (1755-1824) N1b - Charles X of France (1757-1836)
H3 - Marie-Antoinette (1755-1793) H3 - Louis XVII (1785-1795) H3 - Marie Louise of Austria (1791-1847) H3 - Maria Amalia of the Two Sicilies (1782-1866) Belgian Royalty H - Leopold I (1790-1865) H3 - Marie-Louise of France (1812-1850) H3 - Leopold II (1835-1909) H3 - Charlotte of Belgium (1840-1927) Grand Duke of Luxembourg H3 - William I (1772-1843) Stadtholder of Holland and Zeeland T2 - Maurice of Nassau, Prince of Orange (1567-1625) Kings of Saxony H3 - Frederick Augustus II (1797-1854) H3 - John I (1801-1873) Prussian Royalty T2 - Frederick William I of Prussia (1688-1740) H3 - Elisabeth Christine of Brunswick-Bevern (1715-1797) H3 - Frederick William II (1744-1797) H - Victoria of Prussia (1840-1901) H - Wilhelm II (1859-1941) Bohemian Royalty H - Boleslaus II the Pious (920-999) H - Anne of Bohemia and Hungary (1503-1546) H - Ferdinand IV of Bohemia and Hungary (1633-1654)
U5b - Henry VI of Carinthia (1270-1335) U5b - Rudolf I of Habsburg (1282-1307) U5b - Joanna of Bavaria (1362-1386) U5b - Albert II of Germany (1397-1439)
T2 - Elisabeth of Bohemia (1409-1442) T2 - Vladislas II of Bohemia and Hungary (1456-1516) T2 - Elizabeth Stuart (1596-1662)
N1b - Maria Amalia of Austria (1701-1756) N1b - Maria Luisa of Spain (1745-1792) Arpad Dynasty Bavarian Royalty
U5b - Louis II, Duke of Bavaria (1229-1294) U5b - Henry XIII, Duke of Bavaria (1235-1290) U5b - William II, Duke of Bavaria, Count of Holland, Zeeland and Hainaut (1365-1417) U5b - Albert II (1369-1397) U5b - John III, Duke of Bavaria-Straubing, Count of Holland and Hainaut (1374-1425) U5b - Louis IX, Duke of Bavaria-Landshut (1417-1479) German Royalty U5b - Elisabeth of Bavaria (1227-1273) U5b - Elizabeth of Carinthia (1262-1312) U5b - Frederick the Fair, Duke of Austria and King of Germany (1289-1330) U5b - Joanna of Bavaria, Queen of Germany and Bohemia (1362-1386) U5b - Albert II of Germany (1397-1439) Holy Roman Empire T2 -
Barbara of Celje (1390-1451) H - Maximilian II of Habsburg (1527-1576) H - Ferdinand II of Habsburg (1578-1637) H - Leopold I of Habsburg (1640-1705)
N1b - Maria Amalia of Austria (1701-1756) N1b - Maria Josepha of Bavaria (1739-1767) N1b - Maria Luisa of Spain (1745-1792) N1b - Francis II, Holy Roman Emperor (1768-1835) H3 - Leopold II of Habsburg (1747-1792) Austrian Royalty U5b - Rudolf I of Habsburg, Duke of Austria and Styria, King of Bohemia, and titular King of Poland (1282-1307) U5b - Frederick I the Fair, Duke of Austria and Styria, and King of Germany (1289-1330) U5b - Leopold I of Habsburg, Duke of Austria and Styria (1290-1326) U5b - Albert II of Habsburg, Duke of Austria (1298-1358) U5b - Otto I of Habsburg, Duke of Austria (1301-1339)
U5b - Albert II, King of Germany and Archduke of Austria (1397-1439) H3 - Maria Theresa (1717-1780) H3 - Joseph II (1741-1790) H3 - Ferdinand I (1793-1875) H3 - Maria Leopoldina of Austria (1797-1826) N1b - Francis II, Holy Roman Emperor (1768-1835) H - Charles I (1887-1922) Swedish Royalty Z1a - Richeza of Poland, Queen of Sweden (1116-1156) Z1a - Valdemar I of Sweden (1239-1302) Z1a - Magnus III of Sweden (1240-1290) T2 - Gustav II Adolf (1594-1632) T2 - Charles X Gustav (1622-1660) H - Olof Skötkonung (980-1022) H - Christina of Sweden (1626-1689) H - Margaret of Connaught (1882-1920) H - Louise Mountbatten (1889-1965) H - Ingrid (1910-2000) H - Carl XVI Gustaf (1946-) Norwegian Royalty Z1a - Rikissa Birgersdotter of Sweden, Queen of Norway (1237-1288) T2 - Olav V (1903-1991) Danish Royalty H - Sigrid the Haughty (968-1014) H - Harald II (980-1018) H - Canute the Great (994-1035) H - Sweyn II Estridson (1019-1076) H - Margrethe II (1940-) Z1a - Canute V of Denmark (1129-1157) Z1a - Sophia of Minsk, Queen consort of Denmark (1140-1198) Z1a - King Canute VI of Denmark (1163-1202) Z1a - King Valdemar II of Denmark (1170-1241)
Z1a - Queen Richeza of Denmark (1190-1220) T2 - Elizabeth (1524-1586) T2 - Anne (1574-1619) T2 - Christian III T2 - Christian IV T2 - Frederick VI T2 - Christian VIII T2 - Frederick VIII (1843-1912) H3 - Juliana Maria of Braunschweig-Wolfenbüttel (1729-1796) Scottish Royalty U5b - James III (1451-1488)
Clan MacKintosh Clan Douglas Clan McNab Clan Comyn Clan Abercrombie Clan Abernathy Clan Agnew Clan Ainslie Clan Bayne Clan Baird Clan Barron Clan Hamilton Clan Lindsay Clan Graham Clan MacDonald Clan Home Clan Gordon Clan Swinton Clan Spence Clan Skene Clan Paden Clan Nesbitt Clan Menzies Clan Napier Clan Moffat Clan Grant Clan Bruce Clan Sutherland Clan Campbell Clan Drummond Clan MacPherson Clan Lyon Clan Munro Clan Montgomery Clan MacDougall Clan Cochrane Clan Sinclair Clan Erskine Clan Boyle Clan Murray Clan Cameron Clan Mackenzie Clan Macbean Clan Barclay Clan Boyd Clan Armstrong Clan MacLaren Clan Buchanan Clan MacGregor Clan MacLean Clan Colquhoun Clan Stirling Clan Donnachaidh Clan Cathcart Clan Kirkpatrick Clan Carruthers Clan Galbraith
English Royalty T2 - Charles I (1600-1649) T2 - George I (1660-1727) T2 - George III (1738-1820) T2 - Alexandra of Denmark (1844-1925) T2 - George V (1865-1936) H - Henrietta Maria of France (1609-1669) H - Charles II (1630-1685) H - James II (1633-1701) H - William III (1650-1702) H - Victoria (1819-1901) H - Edward VII (1841-1910) H - Prince Philip, Duke of Edinburgh J1c2c - Edward IV (1442-1483) J1c2c - Richard III (1452-1485) R30b - Prince William, Duke of Cambridge Ancient Egypt Persian Royalty Chinese Royalty Saudi Royalty Famous People H - Napoleon I (1769-1821) H3 - Napoleon II (1811-1832)

Imperial House of Japan D1a2a1a2b1a1a8a - Emperor Seiwa (850-881) Nakatomi Clan O1b2a1a1c - Nakatomi no Amahisa-no-kimi Fujiwara Clan O1b2a1a1 - Fujiwara no Kamatari (668) Clan Baxter R1b1a1b1a1a2c1a6c - Reginar Longneck Count of Hainaut (850) R1b1a1b1a1a2c1a6c - William Baxtare (1312) Clan Riddell R1b1a1b1a1a2c1a1i2 - Gervase Ridale (1116) R1b1a1b1a1a2c1a1i2 - Sir William Riddell (1296) Clan Guthrie R1b1a1b1a1a2c1a5b - Alexander Guthrie (1442) Clan Glen R1b1a1b1a1a1c2b3c2a - Colban del Glen (1328) Clan Gray R1b1a1b1a1a2c1a1f1a - Fulbert de Gray (1066) Clan Pollock I2a1b1a2b1a2a1a1a1a3a1 - Petrus de Polos (1163)
Clan Watson R1b1a1b1a1a2c1a1e - John Watson (1392) R1b1a1b1a1a2c1a1e - George Watson (1723) Clan Greer R1b1a1b1a1a2c1a1a1a1a1a1a5 - Gilbert Grierson (1420) Clan Blair R1b1a1b1b3a1a1b - John Francis de Blair (1165-1214) Clan Dundas R1b1a1b1a1a2c1a1e - Serie de Dundas (1296) Clan Wishart R1b1a1b1a1a2a1 - John Wischard (1245) Clan Wemyss R1b1a1b1a1a2c1a5a - Sir John Wemyss (1421)
Clan Weir R1b1a1b1a1a2b - Radulphus de Vere (1150) Clan Lockhart R1b1a1b1a1a2c1a1a1a1a1b1 - Sir Simon Locard (1300-1371) Clan Durie I2a1b1a1a1a - Duncan de Dury (1258) Clan Fletcher R1b1a1b1a1a2c1a4b2c1a1a - Andrew Fletcher of Saltoun (1653-1716) Clan Mac Gobhann R1b1a1b1a1a2c1a1d3b1b2 - Neil Gow (1727) Clan Coyne R1b1a1b1a1a2c1a1a1a1a1b1 - Joseph Sterling Coyne (1803-1868)
Clan Mackendrick R1b1a1b1a1a2c1a5a2a1a3 - Big Henry son of Nechtan (900) Clan Lennox R1b1a1b1a1a2c1b1a - Mathew Earl of Lennox (1511) Clan Leslie I1a3a1a2a1 - George Leslie Earl of Rothes (1447) Clan Stewart R1b1a1b1a1a2c1a1a1a1a1b - Walter Flaad High Steward of Scotland (1164) Clan MacEwan R1b1a1b1a1a2c1a5a2a1a1 - Swene MacEwen (1493) Clan MacNaughten R1b1a1b1a1a2c1a5d3a - Gilchrist Macnachten (1297) Clan Vans R1b1a1b1a1a2c1a2a2a1a - William de Vaus of Direlton (1384)
Clan Urquhart I1a1b1a1e2c4a - William de Urquhart High Sheriff of Cromarty (1325-1395) Clan MacTavish R1b1a1b1a1a2c1a1f1c - Sir Thomas Cambel (1292) Clan MacQuarrie R1b1a1b1a1a2c1a1f1a3 - John Macquarrie of Ulva (1473) Clan Morrison R1b1a1b1a1a2c1a5b1a1a3a3 - Hutcheon Morrison (1550) Clan Johnstone R1b1a1b1a1a2c1a3a2 - John Johnstone (1194) Premyslid Dynasty R1b1a2a1a2c1b1b1a3a1 - Borivoj I (870-889) R1b1a2a1a2c1b1b1a3a1 - Spythinev (895-915) R1b1a2a1a2c1b1b1a3a1 - Vratislaus (915-921) R1b1a2a1a2c1b1b1a3a1 - Saint Wenceslaus (921-935) R1b1a2a1a2c1b1b1a3a1 - Bolesalus I the Cruel (935-972) R1b1a2a1a2c1b1b1a3a1 - Bolesalus II the Pious (972-999) R1b1a2a1a2c1b1b1a3a1 - Boleslaus III the Red-haired (999-1002)
Clan MacAulay R1b1a1b1a1a2a6 - Kenneth MacAlpin King of the Picts (843-858) Clan MacArthur R1b1a1b1a1a1c1 - Iain MacArthur (1427) Clan MacGillivray R1b1a1b1a1a2c1a4b5a1 - Malcolm MacGillivray (1609) Clan ODuffy R1b1a1b1a1a2c1a5d3a1a - Murdagh ODuffy Archbishop of Tuam (1075-1150) Clan MacPhee R1b1a1b1a1a2c1a4d1 - Malcolm Macfie of Colonsay (1615) Clan Lamont R1b1a1b1a1a2c1a1a1a1a1a1a1 - Sir Laumon (1235) Clan Davidson I1a2a2a4b2c2 - Henry Davidson (1762) Clan MacCallum R1b1a1b1a1a1c1b - Ronald MacCaullum (1510) Clan Ryan R1b1a1b1a1a2a - Righin mac Dubhghall (1268) Clan OLeary R1b1a1b1a1a2c1a3a2a1a2a1 - Lugaid Mac Con (173-203) Clan Hodnett R1b1a1b1a1a2c1a5b1a1a4a - William de Hodenet (1272) Clan Costello R1b1a1b1a1a2c1a4b2a1 - Gilbert de Nangle (1193) Clan Dillon R1b1a1b1a1a2c1a2b2b1 - Sir Henry de Leon (1169) Clan Tuite R1b1a1b1a1a2c1a1d7 - John de Tuite (1302) Clan Cotter R1b1a1b1a1a1c2b1b4d - Ottar King of Dublin (1142) Clan Crowley R1b1a1b1a1a2c1a3a2a1b1a - Auliff OCrowley (1488) Clan Carroll R1b1a1b1a1a2c1a5d - Domhnall OCarroll King of Ely (1241) Clan Dunn R1b1a1b1a1a2c1a1a1a1a1c1 - Gillananaomh ODuinn (1102-1160) Clan Kelly R1b1a1b1a1a2c1a1a1a1a1a1a2 - Cellach mac Fionachta (850) Clan Devlin R1b1a1b1a1a2c1a1a1a1a1a1a2c - ODevlin Bishop of Kells (1211) Clan McNamara R1b1a1b1a1a2c1a4b2a1 - Chieftain Cumara (1099) Clan Barrett R1b1a1b1a1a2c1a2b2b - John Baret (1086) Clan Prendergast R1a1a1a1b1a3a2 - Maurice Lord of Prendergast (1172) Clan Bissett R1b1a1b1a1a2c1a2a1a - Walter Byset Lord of Aboyne (1242)
Clan Plunkett R1b1a1b1a1a2c1a2a1a1a1b1 - Richard Plunkett (1340-1393) Clan Walsh R1b1a1b1a1a2c1a2b1a1a2a - Walter Walsh (1572) Clan McQuillan R1b1a1b1a1a2c1a5d3a1a - Hugelin de Mandeville Clan McMonagle R1b1a1b1a1a2c1a1a1a1a1a1a1a1a2 - Bishop Patrick Mac Moengal (1366) Clan Mac Suibhne R1b1a1b1a1a2c1a1f1a1 - Dubhghall Mac Suibhne (1232-1262) Clan Doherty R1b1a1b1a1a2c1a1a1a1a1a1a1a1a2a - Donagh Dochartach (900) Clan McDonnell R1b1a1b1a1a2c1a5d3a1a - Mac Dhomhnaill (1427) Clan Madden R1b1a1b1a1a2c1a4b - Madudan mac Gadhra Mor (-1008) Clan Mooney R1b1a1b1a1a2c1a5a2a1a1 - Rory OMooney (1556) Clan OKeeffe R1b1a1b1a1a2c1a3a2a1a2c - Cathal mac Finguine (742) Clan Moore R1b1a1b1a1a2c1a5b1a1a2a1 - William de More (1086)
Clan Reynolds R1b1a1b1a1a2c1a4b4a1a1 - Eolais mac Biobhsach (900) Clan ORourke R1b1a1b1a1a2c1a1a1a1a1a1a3a - King Fergal ua Ruairc (961) Clan OFlaherty R1b1a1b1a1a2c1a1a1a1a1a1a3a - Muireadhach ua Flaithbheartach (1034) Clan MacCarthy R1b1a1b1a1a2c1a5a1a - Muireadhach Mac Carthaigh (1092) Clan Fitzgerald R1b1a1b1a1a2c1a3a2a1b1a2 - Gerald of Windsor (1075-1135) Clan Burke R1a1a1b1a2b3a3a1a2c2a - William de Burgh (1160-1206) Clan MacGuire R1b1a1b1a1a2c1a2a1a1a1b - Cormac ua Cuinn (204-244) Clan OSullivan R1b1a1b1a1a2c1a3a2 - Suilebhan mac Maolura (862) Clan Jordan R1b1a1b1a1a2a5 - Jordan de Exeter (1239-1258) Clan Dwyer R1b1a1b1a1a2a - Dubhuir mac Spealain (183) Clan Keating R1b1a1b1a1a2c1a4b2b1 - Geoffrey Keating (1569-1644) Clan Cogan R1b1a1b1a1a2c1a1a1a1a1a1a1a1a - Milo de Cogan (1182) Clan OHara R1b1a1b1a1a2c1a2b3a1 - Chief Eaghra (976) Clan Magennis R1b1a1b1a1a2c1a2a1a1a1 - Aedh Mor Magennis (1153) Clan Mac Oisdealbhaigh R1b1a1b1a1a2c1a4b2a1 - Oisdealb (1193) Clan Chaomanach R1b1a1b1a1a2c1a4a - Donal Kavanagh (1171-1175) Clan Eustace I1a2a1a1a1a2b - Bishop of Ely (1215) Clan Butler R1b1a1b1a1a2c1a4b2a1 - Theobald Walter (1205) Clan Le Poer I1a3g - Conmore Count of Poher (490) Clan Carnegie R1b1a1b1a1a1b1a1a - Duthac de Carnegie (1401) Clan McQueen R1b1a1b1a1a2c1a2b2b1 - Domhnall Mac Raghnuill (1250) Clan Farquharson R1b1a1b1a1a2c1a4b3 - Finla Mor (1547) Clan Kennedy R1b1a1b1a1a2c1a2a2a - John Kennedy of Dunure (1372) Clan Ruthven R1b1a1b1a1a2c1a5a2a1a1 - Sir Walter Ruthven (1296) Clan MacKay R1b1a1b1a1a2c1a4b2c1 - Iye Mackay (1210)
Clan Chisholm I1a1b1a1e2e - Sir Robert de Cheseholme (1359) Clan MacKinnon R1b1a1b1a1a2c1a1f1a3 - Findanus (900) Clan MacLachlan R1b1a1b1a1a2c1a1a1a1a1a1a2a2 - Gilchrist Maclachlan (1230) Clan Ogilvie R1b1a1b1a1a2c1a5a - Patrick de Ogilvy (1296) Clan Scott R1b1a1b1a1a1c2b2a1b1b1a1 - Henricus le Scotte (1195) Clan Cockburn R1b1a1b1a1a1b1a1a - Sir Roberto de Cokeburn (1261) Clan MacMillan R1b1a1b1a1a1c1b - Gille Chriosd Clan MacLellan R1b1a1b1a1a2c1a1d3b1b1 - Duncan MacLellan (1217) Clan MacAlister R1b1a1b1a1a2c1b1a - Alasdair Mor (1253) Clan MacFarlane R1b1a1b1a1a2c1b1a - Donnchadh Mac Pharlain (1544) Clan LaMont R1b1a1b1a1a2c1a1f1a - Sir Laumon (1235) Clan MacInnes R1b1a1b1a1a2c1a1b - Aonghais Mor (1294) R1b1a1b1a1a2c1a1b - Aonghais Og (1330) Clan Oliphant R1b1a1b1a1a2c1a6c - Roger Olifard (1093) Clan Elliott R1b1a1b1a1a2c1a2a2a1d1 - Gilbert Scott Elliot (1364) Clan Kerr R1b1a1b1a1a2c1a1a2a - William Ker of Kersland joined Wallace (1296) Clan MacNeil R1b1a1b1a1a2a1b2 - Gilleonan Macneil (1427) Clan Brodie R1b1a1b1a1a2c1a1f1a - Malcolm Brodie (1249-1285)
Clan Gunn R1b1a1b1a1a1b1a - George Gunn Coroner of Caithness (1380-1464) Clan Keith R1b1a1b1a1a2c1a5c1b1a - Sir Robert de Keith (1316) Clan Pringle R1b1a1b1a1a1c2f - David Pringle (1513) Clan Hay R1b1a1b1a1a2b1 - William II de Haya (1160) Clan Dunbar R1b1a1b1a1a1b1a1a - Gospatric Earl of Northumbria (1073) Clan Fraser R1b1a1b1a1a2c1a1e1 - Simon Fraser (1306) Clan MacThomas R1b1a1b1a1a1b - Thomas Tomaidh Mor (1430) Clan Ross R1b1a1b1a1a2c1a2 - Fearchar (1214-1249) Clan Mac Giolla Bhrighde I1a2a1a1a2a2a - John MacGilbride Bishop of Raphoe (1440) Clan Wallace R1b1a1b1a1a1c1a1 - William Wallace Clan Irwin R1b1a1b1a1a2c1a1e1 - Scottish Clan House of Stewart R1b1a1b1a1a2c1a1d1a - Robert II King of Scotland (1371-1390) R1b1a1b1a1a2c1a1d1a - Robert III (1390-1406) R1b1a1b1a1a2c1a1d1a - James I (1406-1437) R1b1a1b1a1a2c1a1d1a - James II (1437-1460) R1b1a1b1a1a2c1a1d1a - James III (1460-1488) R1b1a1b1a1a2c1a1d1a - James IV (1488-1513) R1b1a1b1a1a2c1a1d1a - James V (1513-1542) R1b1a1b1a1a2c1a1d1a - Mary (1542-1567) R1b1a1b1a1a2c1a1d1a - James VI (1567-1625) R1b1a1b1a1a2c1a1d1a1 -
Sir John Stewart of Bonkyll (1245-1298) R1b1a1b1a1a2c1a1d1a3 - Alexander Stewart the Wolf of Badenoch Kingdom of Mann R1b1a1b1a1a2a1b2 - Olof the Black House of Lippe Detmold R1b1a1b1a1a2 - Bernhard I (1123) House von Amsberg R1a1a1b1a2b3a3a1b1 - Juergen Amtsberg (11640-686) R1a1a1b1a2b3a3a1b1 - Prince Claus of the Netherlands (1926-2002) R1a1a1b1a2b3a3a1b1 - King Willem-Alexander of the Netherlands (1967-) House of Saxe-Coburg R1b1a1b1a1a1c1a1 - Ernest I Duke of Saxe-Coburg and Gotha (1784-1844) House of Capet J1a2b1b2c1 - King Hugh Capet of France Clann Mac Diarmada R1b1a1b1a1a2c1a1a1a1a1a1a2 - Dermot Mac Tadhg Mor 7th King of Moylurg (1124-1159) R1b1a1b1a1a2c1a1a1a1a1a1a2 - Tadhg Mac Diarmata (1585) Clann ODomhnaill R1b1a1b1a1a2c1a1a1a1a1a1a1 - Niall Noigiallach King of Tara (405) R1b1a1b1a1a2c1a1a1a1a1a1a1
HIGH KINGS OF IRELAND DNA MARKERS
Kings of Tyrconnell R1b1a1b1a1a2c1a1a1a1a1a1a1 - King of Leth Cuinn Clann Chindfaoladh R1b1a1b1a1a2c1a1a1a1a1a1a1a1a - Conall Gulban son of Niall of the Nine Hostages (464) Clann Ui Eidersceoil I2a1a2a1b1c1a - Lughaidh Laidhe Clann McGrath R1b1a1b1a1a2c1a1a1a1a1a1a2 - Echthighern Mac Cennetig (?-950) R1b1a1b1a1a2c1a1a1a1a1a1a2 - Craith (970) R1b1a1b1a1a2c1a1a1a1a1a1a2 - Archbishop Miller McGrath (1523-1622) Clann ODuibhgeannain R1a1a1b2a2a1d9c2a - Maine of Tethba R1a1a1b2a2a1d9c2a - Maelpeter ODuigennan Archdeacon of Breifny Clann OMaolagain R1b1a1b1a1a2c1a1a1a1a1a1a5 - Chiefs of Tir MacCarthainn Clann OLachtna R1b1a1b1a1a2c1a1a1a1a1a1a - Eochaidh Muighmheadhoin King of Ireland (350 AD) R1b1a1b1a1a2c1a1a1a1a1a1a - Ui Fiachrach chiefs of the Two Bats and Glen Nephin R1b1a1b1a1a2c1a1a1a1a1a1a - Conghalach OLoughlin Bishop of Corcomroe (1281) Clann Mac Donnchada R1b1a1b1a1a2c1a3a2a1a2d1a - Donnchad Midi High King of Ireland (733-797) R1b1a1b1a1a2c1a3a2a1a2d1a - Conchobar Mac Donnchada High King of Ireland (819-833) Clann Mac Murchadha R1b1a1b1a1a2c1a4a1 - Diarmait Mac Murchada King of Leinster (1110-1171) Clann Coffey R1b1a1b1a1a2c1a3a2a1b1b - Dermot OCoffey (1580) Clann Dal gCais R1b1a1b1a1a2c1a4b2a1a1 - Brian Boruma mac Cennetig (941-1014) Clann Deaghaidh R1b1a1b1a1a2c1a4b2a1c - Chief Deaghaidh (934)
Clann Laigin R1b1a1b1a1a2c1a1a1a1a1 - Labraid Loingsech High King of Ireland (369) Clann Mac Bradaigh R1b1a1b1a1a2c1a4b2c1a - Thomas Brady (1752-1827) Clann Mag Samhradhain R1b1a1b1a1a2c1a1a1a1a1a1a3a - Muireadhach mac Samhradhain (1115-1148) Riddarhuset Gyllencreutz R1b1a1b1a1a2c1a4b2c1a1b1b1 - Lars Tygesson (?-1625) Riddarhuset Lillieskold R1b1a1b1a1a1c2b2a1b2 - Jesperus Marci (?-1591) Riddarhuset Tawast N1a1a1a1a1a1a1b2a2a1 - Jakob Kaas (?-1529) Riddarhuset Loewenhielm I1a1b1b1c - Gudmund Norberg (1656-1739) Riddarhuset Aminoff G2a2b1a1b1a2 - Feodor Aminoff (1565-1628) Riddarhuset Uggla R1b1a1b1a1a1c2b2a1b1a1a2b2a - Claes Hansson (?-1529) Riddarhuset Silfverskiold R1a1a1b1a3a1a2e2a - Niklas Andersson Hylten (1635-1702) Riddarhuset Stierna R1a1a1b1a2b3a1d5a1b - Olof Olofsson Stjaerna (1430-1498) Riddarhuset Bure G2a2b2a1a1b1a1a2a1b2a1 - Olof Bure (1578-1655) Welsh Royalty R1b1a1b1a1a2c1a5a1 - Pasgen ap Urien, King of Gwyr (522)
Grand Princes of Kiev N1a1a1a1a1a1a - Vladimir II Monomakh (1053-1125) N1a1a1a1a1a1a - Mstislav I of Kiev (1076-1132) N1a1a1a1a1a1a - Yaropolk II of Kiev (1082-1139) N1a1a1a1a1a1a - Viacheslav I of Kiev (1083-1154) N1a1a1a1a1a1a - Yuri Dolgorukiy (1090-1157) N1a1a1a1a1a1a - Iziaslav II of Kiev (1097-1154) N1a1a1a1a1a1a - Rostislav I of Kiev (1110-1167) N1a1a1a1a1a1a - Yaroslav II of Kiev (1132-1180) N1a1a1a1a1a1a - Roman the Great (1152-1205) N1a1a1a1a1a1a - Rurik Rostislavich (-1215) N1a1a1a1a1a1a - Ingvar of Kiev (1152-1220) N1a1a1a1a1a1a - Mstislav III of Kiev (died 1223) N1a1a1a1a1a1a - Rostislav II of Kiev (1173-1214) N1a1a1a1a1a1a - Vladimir IV Rurikovich (1187-1239) N1a1a1a1a1a1a - Daniel of Galicia (1201-1264) N1a1a1a1a1a1a - Alexander Nevsky (1220-1263) N1a1a1a1a1a1a - Lev I of Galicia (1228-1301) N1a1a1a1a1a1a - Yaroslav of Tver (1230-1271) N1a1a1a1a1a1a - Yuri I of Galicia (1252-1308) N1a1a1a1a1a1a - Andrew of Galicia (?-1323) N1a1a1a1a1a1a - Lev II of Galicia (?-1323) Grand Dukes of Lithuania N1a1 - House of Gediminas (1285-1440) Russian Royalty Romanovs R1b - Paul I (1754-1801) R1b - Alexander I (1777-1825) R1b - Constantine I (1779-1831) R1b - Nicholas I (1796-1855) R1b - Alexander II (1818-1881) R1b - Alexander III (1845-1894) R1b - Nicholas II (1868-1918) Greek Royalty R1b - George I (1845-1913) R1b - Constantine I (1868-1923) R1b - Alexander (1893-1920) R1b - George II (1890-1947) Romanian Royalty Bulgarian Royalty R1b1a1b1a1a1a - Ferdinand I (1861-1948) R1b1a1b1a1a1a - Boris III (1894-1943) R1b1a1b1a1a1a - Simeon II (b. 1937) Polish Royalty J2b2a1a1a1b -
House of Lubomirski House of Grimaldi I1a1b1a1e2 - Jacques I, Prince of Monaco (1689-1751) I1a1b1a1e2 - Honoré III (1720-1795) I1a1b1a1e2 - Honoré IV (1758-1819) I1a1b1a1e2 - Florestan I (1785-1856) I1a1b1a1e2 - Charles III (1818-1889) I1a1b1a1e2 - Albert I (1848-1922) I1a1b1a1e2 - Louis II (1870-1949) Portuguese Royalty R1b1a1b1a1a1a - Pedro V (1837-1861) R1b1a1b1a1a1a - Luis I (1838-1889) R1b1a1b1a1a1a - Carlos I (1863-1908) R1b1a1b1a1a1a - Manuel II (1889-1932) Spanish Royalty Sardinian Royalty Dukes of Parma R1b1b2a1a1b -
House of Bourbon-Parma Italian Royalty Grand Duke of Tuscany French Royalty R1b1b2a1a1b - Francis I (1494-1547) R1b1b2a1a1b - Henry IV (1553-1610) R1b1b2a1a1b - Louis XIII (1601-1643) R1b1b2a1a1b -
Louis, Dauphin of France (1661-1711) R1b1b2a1a1b - Louis XV (1710-1774) R1b1b2a1a1b - Louis XVI (1754-1793) R1b1b2a1a1b - Louis XVII (1785-1795) R1b1b2a1a1b - Louis XVIII of France (1755-1824) R1b1b2a1a1b - Charles X of France (1757-1836) G2a - Louis XVI Relic G2a - Henri IV Relic Belgian Royalty R1b1a1b1a1a1a - Leopold I (1790-1865) R1b1a1b1a1a1a - Leopold II (1835-1909) R1b1a1b1a1a1a - Albert I (1875-1934) R1b1a1b1a1a1a - Leopold III (1901-1983) R1b1a1b1a1a1a - Baldwin I (1930-1993) R1b1a1b1a1a1a - Albert II (1934-) R1b1a1b1a1a2c1a6c - House of Reginarids R1b1a1b1a1a2c1a6c - Counts of Hainaut R1b1a1b1a1a2c1a6c - Counts of Louvain and Brussels R1b1a1b1a1a2c1a6c - Dukes of Brabant and Lothier R1b1a1b1a1a2c1a6c - House of Hesse Grand Duke of Luxembourg Stadtholder of Holland and Zeeland Kings of Saxony Prussian Royalty Bohemian Royalty Arpad Dynasty R1a1a1b2a2a - Bela III R1a1a1b2a2a - Emeric R1a1a1b2a2a - Ladislaus III R1a1a1b2a2a - Andrew II R1a1a1b2a2a - Bela IV R1a1a1b2a2a - Stephen V R1a1a1b2a2a - Ladislaus IV R1a1a1b2a2a - Andrew, Duke of Slavonia Bavarian Royalty German Royalty I2a1b1a2a1b - House of Hohenzollern I2a1b1a2a1b -
Dukes of Prussia (1525-1701) I2a1b1a2a1b - Kings of Prussia (1701-1918) I2a1b1a2a1b - Frederick William I2a1b1a2a1b - Frederick I I2a1b1a2a1b - Frederick William I I2a1b1a2a1b - German Emperors (1871-1918) I2a1b1a2a1b - William I I2a1b1a2a1b - Frederick III I2a1b1a2a1b - William II R1b1a1b1a1a1c1a1 - House of Wettin Holy Roman Empire Austrian Royalty R1b1a1b1a1a2b1 - Habsburg Family R1b - Leopold I, Margrave of Austria (died 994) R1b - Henry I, Margrave of Austria (died 1018) R1b - Adalbert, Margrave of Austria (985-1055) R1b - Ernest, Margrave of Austria (1027-1075) R1b - Leopold II, Margrave of Austria (1050-1095) R1b - Leopold III, Margrave of Austria (1073-1136) R1b - Leopold IV, Margrave of Austria, aka Leopold I, Duke of Bavaria (1108-1141) R1b - Henry II, Duke of Austria, aka Henry XI, also Duke of Bavaria (1107-1177) R1b - Leopold V, Duke of Austria (1157-1194) R1b - Frederick I, Duke of Austria (1175-1198) R1b - Leopold VI, Duke of Austria (1176-1230) R1b - Frederick II, Duke of Austria (1211-1246) Swedish Royalty I1 - Valdemar I of Sweden (1239-1302) I1 - Magnus III of Sweden (1240-1290) I1 - Birger I of Sweden (1280-1321) I1 - Valdemar, Duke of Finland (1280s-1318) I1 - Magnus IV of Sweden (1316-1374) I1 - Eric XII of Sweden (1339-1359) I1 - Haakon VI of Sweden & Norway (1340-1380) R1b - Christian I (1426-1481) R1b - John (1455-1513) R1b - Christian II (1481-1559) G2a2b2a1a1b1a1a2a1b2a1 - Gamla Olof Heresson Bure Norwegian Royalty I1 -
Haakon VI of Sweden & Norway (1340-1380) R1b - Haakon VII (1872-1957) R1b - Olav V (1903-1991) R1b - Harald V (1937-) Danish Royalty I1 - Olaf II of Denmark & Norway (1370-1387) R1b - Christian I (1426-1481) R1b - John (1455-1513) R1b - Christian II (1481-1559) R1b - Frederick I R1b - Christian III R1b - Frederick II R1b - Christian IV R1b - Frederick III R1b - Christian V R1b - Frederick IV R1b - Christian VI R1b - Frederick V R1b - Christian VII R1b - Frederick VI R1b - Christian VIII R1b - Frederick VII R1b - Christian IX (1818-1906) R1b - Frederick VIII (1843-1912) R1b - Christian X (1870-1947) R1b - Frederick IX (1899-1972) Scottish Royalty R1b1a1b1a1a2c - Robert II R1b1a1b1a1a2c - Robert III R1b1a1b1a1a2c - James I R1b1a1b1a1a2c - James II R1b1a1b1a1a2c - James III R1b1a1b1a1a2c - James IV R1b1a1b1a1a2c - James V J2a1 - Earl of Eglinton (1460-1545) R1a1a1b1a3a1a1a -
Somerled of Argyll (1100-1164) Clan MacKintosh I2a1b1a2b1a2a3b1a1 - Shaw MacDuff (1160) Clan Douglas E1b1b1a1b1a10b - Alexander Douglas (1625) Clan McNab R1b1a1b1a1a2c1a1a1a1a1 - Fergus Mac Echdach (778) Clan Comyn R1b1a1b1a1a2c1a4b2c1 - Richard Comyn (1115-1179) Clan Abercrombie R1b1a1b1a1a2c1a1e - Robert Abercromby (1534) R1b1a1b1a1a2c1a1e - Sir Ralph Abercromby (1734-1801) Clan Abernathy R1b1a1b1a1a2c1a - Orm de Abernethy (1170) Clan Agnew I2a1b1a1a1a1a1b3 - Alastair (1299) Clan Ainslie R1a1a1b1a1a1c1e - Thomas de Aneslei (1221) Clan Bayne R1b1a1b1a1a2c1a1h1 - Donald Mackay (1370) Clan Baird R1a1a1b1a3a1a - Richard Baird (1390) Clan Barron R1b1a1b1a1a1c1a2b - Bonaventure Baron (1610-1696) Clan Hamilton I1a2a1a1a4 - Walter fitz Gilbert of Hambledon I1a2a1a1a4 - Laird of Cadzow (1315) I1a2a1a1a4 - Lord Hamilton (1445) I1a2a1a1a4 - Earl of Arran (1503) I1a2a1a1a4 - Marquess of Hamilton (1599) I1a2a1a1a4 - Duke of Hamilton (1643) Clan Lindsay I2a1a1b1a1b2 - Sir Walter de Lindissie I2a1a1b1a1b2 - Earl of Crawford (1398-present) I2a1a1b1a1b2 - Earl of Lindsay (1633-present) I2a1a1b1a1b2 - Earl of Balcarres (1651-present) Clan Graham J1a1b1b1a2a1a1a1a - Clan Graham Clan MacDonald R1a1a1b1a3a - Clan MacDonald Clan Home R1a1a1b1a3a1a1 - Cospatric I Anglo-Danish Earl of Northumbria (1073) R1a1a1b1a3a1a1 - Earl of Home (1605-present) Clan Gordon R1b1a1b1a1a1e1b - Alexander Seton (1408) R1b1a1b1a1a1e1b - Alexaneder Gordon 1st Earl of Huntly (1470) R1b1a1b1a1a1e1b - Marquesses of Huntly (1599-present) R1b1a1b1a1a1e1b - Dukes of Gordon (1684-1836) R1b1a1b1a1a1e1b -
Earls of Aberdeen (1682) R1b1a1b1a1a1e1b -
Marquesses of Aberdeen and Temair (1916-present) Clan Swinton R1a1a1b1a3a1a1 - Ernulf de Swinton (1136) Clan Spence R1b1a1b1a1a2c1a4a - Thomas de Spens (1296) Clan Skene R1b1a1b1a1a1e2a - John de Skeen (1093) R1b1a1b1a1a1e2a - Robert Skene (1317) Clan Paden R1b1a1b1a1a1c2c1 - Hugh Pethin (1611) Clan Nesbitt R1b1a1b1a1a2c1a5b1a1 - Alexander Nisbet (1657-1725) Clan Menzies R1b1a1b1a1a2c1a6 - Sir Robert de Myneris (1237) Clan Napier R1b1a1b1a1a2c1a1e1 - Sir Archibald Napier of Merchiston (1625) Clan Moffat R1b1a1b1a1a1c2b2a1b1a1a1 - Nicholas de Moffat (1286) Clan Grant R1b1a1b1a1a2e1 - Duncan Grant of Freuchie (1413-1485) R1b1a1b1a1a2e1 - Earls of Seafield (1701-present) R1b1a1b1a1a2e1 - Barons Strathspey (1858-present) Clan Bruce R1b1a2a1a2a - Robert the Bruce R1b1a2a1a2a - David II of Scotland R1b1a2a1a2a - Edward Bruce R1b1a2a1a2a - Lords of Annandale (1124) R1b1a2a1a2a - Barons of Clackmannan R1b1a2a1a2a - Lords Bruce of Kinloss (1608) R1b1a2a1a2a - Earls of Elgin (1633) R1b1a2a1a2a - Earls of Kincardine (1647) Clan Sutherland R1b1a1b1a1a2a - Freskin of Flanders R1b1a1b1a1a2a - William de Moravia (1210-1248) R1b1a1b1a1a2a - Earl of Tullibardine (1606) R1b1a1b1a1a2a - Earl of Atholl (1629) R1b1a1b1a1a2a - Marquess of Atholl (1676) R1b1a1b1a1a2a - Duke of Atholl (1703)
Clan Campbell R1b1a1b1a1a2c1a1f1c1 - Lord Campbell (1445) R1b1a1b1a1a2c1a1f1c1 - Earl of Argyll (1457) R1b1a1b1a1a2c1a1f1c1 - Marquess of Argyll (1641) R1b1a1b1a1a2c1a1f1c1 - Duke of Argyll (1701-present) R1b1a1b1a1a2c1a1f1c1 - Earls of Loudoun (1633-1786) Clan Drummond R1b1a1b1a1a2c1a2a2a1e - Lord Drummond of Cargill (1488) R1b1a1b1a1a2c1a2a2a1e - Earl of Perth (1605-present) R1b1a1b1a1a2c1a2a2a1e - Duke of Perth (1716-1800) Clan MacPherson R1b1a1b1a1a2c1a2a3a - Clan MacPherson Clan Lyon I1a1b1a1d - John Lyon Lord of Glamis (1340-1382) I1a1b1a1d - Lord Glamis (1445) I1a1b1a1d - Earls of Kinghorne (1606) I1a1b1a1d - Earls of Srathmore and Kinghorne (1677-present) I1a1b1a1d - Claude Bowes-Lyon Clan Munro I2a1a2a1b1a2b - Munros of Foulis I2a1a2a1b1a2b - James Monroe (1758-1831) Clan Montgomery J2a1a2b2a2b2a2b - Alexander Montgomerie 1st Lord Montgomerie (1470) J2a1a2b2a2b2a2b - Earl of Eglinton (1508-present) J2a1a2b2a2b2a2b - Earl of Winton (1859-present) Clan MacDougall R1a1a1b1a3a1a1a - Clan MacDougall Clan Cochrane R1a1a1b1a3a1b3c1b - Waldenus De Cochrane (1240-1300) R1a1a1b1a3a1b3c1b - Earl of Dundonald (1669-present) Clan Sinclair R1b1a1b1a1a1c2b2a1b1a4b2a2c1a1 - Earl of Orkney (1739-1479) R1b1a1b1a1a1c2b2a1b1a4b2a2c1a1 - Earl of Caithness (1455-present)
Clan Erskine R1b1a1b1a1a2b2 - John Erskine 19th Earl of Mar (1558-1634) Clan Boyle R1b1a1b1a1a2a1b1a1 - Earls of Glasgow Clan Murray R1b1a1b1a1a2a - Freskin of Flanders R1b1a1b1a1a2a - William de Moravia (1210-1248) R1b1a1b1a1a2a -
Earl of Tullibardine (1606) R1b1a1b1a1a2a -
Earl of Atholl (1629) R1b1a1b1a1a2a - Marquess of Atholl (1676) R1b1a1b1a1a2a - Duke of Atholl (1703) Clan Cameron R1b1a1b1a1a2c1a4d1 - Cameron of Lochiel R1b1a1b1a1a2c1a4d1 - Donal Dubh Clan Mackenzie R1b1a1b1a1a2c1a2a2d - Kenneth Mackenzie 1st of Kintail (1304) R1b1a1b1a1a2c1a2a2d - Earl of Seaforth (1623-1781) R1b1a1b1a1a2c1a2a2d - Earl of Cromartie (1703-1746) R1b1a1b1a1a2c1a2a2d - Alexander Mackenzie of Kintail Clan Macbean R1b1a1b1a1a2c1a1f1a - Gilles MacBean (1746) Clan Barclay I2a1a1a1a1a1a1 - Barclay de Tolly I2a1a1a1a1a1a1 - Michael Andreas Barclay de Tolly (1761-1818)
Clan Boyd R1b1a1b1a1a1c2a1c2 - Lord Boyd (1454) R1b1a1b1a1a1c2a1c2 - Earl of Kilmarnock (1661-1746) Clan Armstrong R1b1a1b1a1a2 - Lowland Scottish Clan Armstrong R1b1a1b1a1a2 - Neil Armstrong Clan MacLaren R1b1a1b1a1a2c1a1f1a1 - Highland Scottish Clan MacLaren Clan Buchanan R1b1a1b1a1a2c1a1f1 - Anselan O Kyan King of North Ulster (1016) R1b1a1b1a1a2c1a1f1 - Sir Alexander Buchanan (1424) R1b1a1b1a1a2c1a1f1 - Sir George Buchanan (1650) Clan MacGregor R1b1a1b1a1a2c1a1f1 - Rob Roy MacGregor (1671-1734) R1b1a1b1a1a2c1a1f1 - Baronet MacGregor of MacGregor (1795-present) Clan MacLean R1b1a1b1a1a2c1a2a2a1b1 - Gillean of the Battle Axe (1263) R1b1a1b1a1a2c1a2a2a1b1 - Lachlan Lubanach Maclean (1325-1405) Clan Colquhoun E1b1b1a1b1a14a - John Calhoun (1782-1850) Clan Stirling I1a2a1a1a2a1 - Thoraldus de Strivelyn (1147) I1a2a1a1a2a1 - Alexander de Strivelyn Laird of Cadder (1304) I1a2a1a1a2a1 - Sir John de Strivelyn (1333) Clan Donnachaidh R1b1a1b1a1a2b - Donnachaidh Reamhar (1306) R1b1a1b1a1a2b - Robert Riabhach Duncanson (1406) R1b1a1b1a1a2b - Alexander Robertson (1645) Clan Cathcart R1b1a1b1a1a2a - Rainaldus de Kethcart (1178) R1b1a1b1a1a2a - William de Cathcart (1296) R1b1a1b1a1a2a - Alan Cathcart 4th Lord Cathcart (1568) Clan Kirkpatrick E1b1b1a1b1a14a - Sir Roger Kirkpatrick (1357) Clan Carruthers I1a1b1b - Nigel de Karruthers (1380) I1a1b1b - Sir Simon Carruthers (1548) Clan Galbraith R1b1a1b1a1a1c2b1b - Gilchrist Bretnach R1b1a1b1a1a1c2b1b - Sir William Galbraith of Buthernock (1255)
English Royalty G2 - Richard III (1452-1485) R1b1a1b1a1a2c - James I (1566-1625) R1b1a1b1a1a2c - Charles I (1600-1649) R1b1a1b1a1a2c - Charles II (1630-1685) R1b1a1b1a1a2c - James II (1633-1701) R1b1a1b1a1a1c1a1 - Edward VII (1841-1910) R1b1a1b1a1a1c1a1 - George V (1865-1936) R1b1a1b1a1a1c1a1 - Edward VIII (1894-1972) R1b1a1b1a1a1c1a1 - George VI (1895-1952) R1b - Prince Philip, Duke of Edinburgh R1b - Charles, Prince of Wales R1b - Prince William, Duke of Cambridge I2a1b1a1a1b - House of Clinton I2a1b1a1a1b - Sir John de Clinton 1st Baron Clinton I2a1b1a1a1b - Earls of Lincoln (1572-present) I2a1b1a1a1b - Dukes of Newcastle-under-Lyne (1768-1988) I2a1b1a1a1b - Sir Henry Clinton (1730-1795)
Ancient Egypt E1b1a - Ramesses III (1217 BC-1155 BC) Persian Royalty J1 - Fath Ali Shah Qajar (1772-1834)
Chinese Royalty C-M401 - Nurhaci, Qing dynasty (1559-1626) Saudi Royalty J1-FGC2 - Muhammad bin Saud (1744-1818) Famous People D1b1a2b1a1 - Emperor Higashiyama O2a2b1a1a1c - Hata Clan Japan E1b1b1b2a1a - Napoleon I (1769-1821) I2a2a - Napoleon III E1b1a - Nelson Mandela E1b1b1 - Lyndon B Johnson E1b1b1 - Adolf Hitler E1b1b1 - David Attenborough E1b1b1 - Richard Attenborough E1b1b1a2 - Orville Wright E1b1b1a2 - Wilbur Wright E1b1b1a2 - Albert Einstein G2a1 - Joseph Stalin I1 - Leo Tolstoy I1 - Warren Buffett I1 - Alexander Hamilton I1 - Calvin Coolidge I1 - Bill Clinton I1 - Sting I2a1a2b - Martin Luther I2a1a2b - Novak Djokovic I2a1a2a1b1a2b - James Monroe I2a1b1a1a1b - Bill Gates R1a1a1b1a1a1c1 - Nikola Tesla I2a1b1a2b1 - John Tyler I2a1b1a2b1a2 - Davy Crockett I2a1b1a2b1a3a1a1a - Andrew Johnson I2a1b1a2b1a2a1a1a1a1a2 - Chuck Norris I2a1b1a2b1a2a1a1a1a3a1 - Steven King I2a2a1b1b1a1a1 - Elvis Presley I2a2a1 - Duke of Hamilton I2a2a1 - Henry Luce I2a2b - Myles Standish I2a2b - Paul Reynaud R1a1a1b1a2 - Max von Sydow J2a1a1a2b2a2b3a - Rothschild Family J2a1a1b2a1a - Prime Minister John Curtin R1a1a1a1d2b3 - Sir Francis Drake R1a1 - Tom Hanks R1b1a1b1a1a2b1 - George Washington R1b1a1b1a1a2b1c1b - Abraham Lincoln R1b - John Adams R1b - John Quincy Adams R1b - Ulysses S Grant R1b - William McKinley R1b - Woodrow Wilson R1b - Che Guevara R1b - Charles Darwin
The Dangers Of Royal Inbreeding From the Spanish Habsburgs to Queen Victoria’s grandchildren, how centuries of inbreeding and genetic mutation led Europe’s royal families to ruin He endured violent convulsions and hallucinations, and his pronounced underbite and engorged tongue meant he was unable to close his teeth together. The malformed jaw made eating and talking nearly impossible, and he suffered uncontrollable spells of diarrhoea and vomiting. It was rumoured that he was bewitched; his painful and disfigured body the result of witchcraft, a curse, or the ritual consummation of the brains of criminals that he had devoured in hot chocolate drinks. But the truth was just as unsavoury and much closer to home. Charles II of Spain’s birth defects were the result of the accumulation of over two centuries of inbreeding. ADVERTISING Charles was unable to speak at all until he was four, and it wouldn’t be until the age of eight that he would take his first steps. He was born to Philip IV of Spain (1605-1655) and Mariana of Austria (1634-1665); a matrimony of uncle and niece, which made young Charles not only their son but also their great-nephew and first cousin respectively. Unfortunately their consanguineous marriage was not a solitary ill-fated pairing. Instead it had become a habit in the Habsburg family, especially the Spanish line. Incestuous relationships had been so common in his dynasty and for so long that by the time Charles II was born he was more inbred than a child whose parents were brother and sister. In Europe, royal inbreeding to one degree or another was most prevalent from the Medieval era until the outbreak of the First World War. Unable to marry commoners and faced with a dwindling dating pool of royals of equivalent social status – especially as Reformation and revolution diminished the available stock increasingly rapidly from the 16th century onwards – the only viable option was to marry a relative. Those expected to succeed to the throne were unable to make morganatic matches – unions between royals and those of lesser rank. But even when the bride or groom-to-be held the title of prince or princess, unequal unions were discouraged. It was a surprisingly nuanced affair and could make or break a regime’s legitimacy. Queen Victoria’s (1819-1901) marriage to her first cousin Prince Albert (1819-1861) in 1840 was controversial, not because of their close kinship but because while she was the descendant of a king (George III of Great Britain), and was born a royal princess (Her Royal Highness), he was the son of the Duke of Saxe-Coburg-Saarfield, one of myriad minuscule German principalities. While still a prince Albert was a prince of a very different – lesser – magnitude and styled as His Serene Highness instead. The worst this union caused Victoria and Albert was social awkwardness, but for more fragile regimes in more tempestuous political climates the need to marry royal princes to royal princesses of the correct denomination of Christianity, saw them look along their own family lines for unattached blue bloods of appropriate pedigree. While the practice of marrying blood relatives served a dynastic purpose to preserve privilege and power within family lines (particularly useful in an era where noblewomen wielded little direct influence, save as matchmakers or regents for their underage offspring), the Habsburgs indulged the custom with particularly reckless abandon. This led to the eventual extinction of an entire branch of the family. The Spanish Habsburg dynasty was effectively founded by Holy Roman Emperor Charles V (1500-1558), who through various canny marital hookups found himself heir to three families: his own which dominated central Europe, the House of Valois-Burgundy, which dominated the low countries, and the House of Trastámara which ruled Spain and its overseas empire in America and Asia. This concentration of power proved too much for one man and he was succeeded by his young brother Ferdinand I (1503-1564) as Archduke of Austria and King of Hungary, and on his older brother’s death Holy Roman Emperor. The title of King of Spain and the lands associated with it, be they in the Netherlands, South America or Sicily, continued down Charles V’s line. Each branch ran in parallel, and there was always someone to marry from the other side of the family. Over the next 200 years a total of 11 marriages were contracted by the Spanish Habsburg kings. Most of these marriages were consanguineous unions, with nine occurring in a degree of third cousins or closer. The Habsburgs’ territorial acquisition via marriage became so established that the dynasty gained a motto attributed to their tactics, “Bella gerant alii, tu, felix Austria, nube!” (“Let others wage war. You, happy Austria, marry!”). A typical story of what became a very tangled family tree can be seen with Charles V and his wife Isabella of Portugal (1503-1529). They had two children – Philip II of Spain (1527-1598), and a daughter Maria of Austria (1528-1603). The dynasty feared that if Philip died before he had a male heir, Spain would be lost. So the decision was made to marry Maria to her first cousin Maximilian II (1527-1576). As the eldest son to Ferdinand I, Maximilian II had inherited their central European titles and lands after his father’s death, and so the Holy Roman Emperor married his own eldest daughter, Anna of Austria (1527-1576), back to the other side of the family to her uncle, Philip II of Spain (1527-1498). This acted as insurance after Philip II’s third wife, Elisabeth, died in childbirth, leaving him widowed with two daughters. These intermarriages crossing from one side of the family to the other repeat over the generations, either between uncles/aunts and nephews/nieces or between cousins. But, unbeknownst to the royal family, they had started to pass down more than crowns, crests and other baubles to their descendants. In the 16th century, the Holy Roman Emperor Charles V had once ruled much of what is now Germany, Hungary, the Czech Republic, Spain, the Netherlands, Belgium, southern Italy, western Poland, and emerging colonies in America and Asia. His was the first empire upon which “the sun never set”. But a century later, the genetic line had deteriorated so severely that the final male heir was physically incapable of producing children. Subsequently bringing an end to Spanish Habsburg rule and the family branch became extinct. When a child is born they contain a shuffled mix of combined genetic material their two parents. But when the gene pools in two people are very similar there is a higher chance that the child will inherit something dangerous. Either arising as a spontaneous mutation or lurking dormant for generations, aggressive inherited diseases are usually ‘recessive’ and require both parents to be carriers of the genetic condition for it to be passed along to their offspring. As carriers do not have symptoms of the disease the parents are often oblivious to the deadly combination of code they will pass onto their offspring. While these diseases are usually rare, when two individuals are related the chances are higher that they will have the same dangerous genes. The closer the genetic relationship, the higher the genetic similarity. While third cousin matches might be safe the risk is significantly ramped up when the blood relatives are even closer, such as siblings. It starts to become an even bigger problem when not only your father is your uncle, but your grandmother is also your aunt as in the case of Charles II of Spain. When a family has a history of generations of inbreeding these recessive mutations start appearing more frequently until a child is born that is battling myriad diseases. Children unlucky enough to be born as a result of incestuous pairings are substantially more likely to suffer from congenital birth defects and will be at a higher risk of infant loss, cancer, and reduced fertility. In the Spanish Habsburgs the most distinctive effect of inbreeding was the ‘Habsburg jaw’. Medically known as mandibular prognathism, the defect is commonly associated with inbreeding, and like many other rare diseases, is a trait associated with recessive genes. In the case of Charles II of Spain, there are two genetic diseases that are believed to have contributed to his demise: combined pituitary hormone deficiency, which causes infertility, impotence, weak muscles, and digestive problems, and distal renal tubular acidosis, which causes bloody urine, rickets, and a large head relative to one’s body size. It was not just the Habsburgs that were plagued with diseases and deformities at the hands of inbreeding. Queen Victoria likely developed a spontaneous mutation in her genes that caused her to carry the genetic disease haemophilia. The rare bleeding disorder that prevents the blood from clotting effectively causing its victims to bleed out, and the most trivial of bumps to produce internal haemorrhaging. Queen Victoria married her first cousin who was also a carrier of the fatal disease. When the two sets of genes combined in their children the disease fired into action and the pair subsequently spread the condition throughout European royalty, to Spain, Germany and Russia. One of Victoria’s own children died from complications due to haemophilia, while a further five grandchildren succumbed in the following decades. George III is thought to have been affected by another recessive disease – porphyria – which is caused by the inheritance of two recessive genes and characterised by blue urine and insanity. Porphyria was common in the highly inbred House of Hanover. Victoria is also believed to have bequeathed porphyria to some of her descendants, most dramatically the German House of Hohenzollern (already descended from George I of Great Britain) where it may have contributed to Kaiser Wilhelm II’s erratic behaviour in the years leading up to the First World War. In November 1908, Reginald Brett, 2nd Viscount Esher – courtier and confidant of Britain’s Edward VII – speculated as much, writing in his diary, “I am sure that the taint of George III is in his blood.” Queen Victoria’s eldest daughter, Princess Victoria, also showed the same tell-tale symptoms of porphyria. She had been married off to Frederick III, the first German Kaiser, their union resulted in the unpredictable Wilhelm II and sickly Princess Charlotte. The princess spent her life suffering from abdominal pains, blisters around her face, and dark red urine. The undiagnosed ailment was passed onto her daughter Princess Feodora of Saxe-Meiningen, who committed suicide in 1945, and a 1998 analysis of her remains proved inconclusive. For the Spanish Habsburgs though, their story ended on 1 November 1700. While Charles II was married twice, in 1679 to Marie Louise of Orléans (1662-1689) and after her death to Maria Anna of Neuburg (1667-1740), he had never conceived a child and was in all likelihood unable to do so. He had spent most of his reign powerless, with others acting as regent. He retired young, unable to cope with the demands of being a ruler, with a frail and feeble body that had started to crumble. He had come to resemble an elderly man and was almost completely immobile due to the oedema swelling in his legs, abdomen, and face. He died bald, senile, and impotent, aged just 38. For Charles II, his life was difficult and tragically short. The true extent of his conditions were not revealed until a grisly autopsy that stated his body “did not contain a single drop of blood; his heart was the size of a peppercorn; his lungs corroded; his intestines rotten and gangrenous; he had a single testicle, black as coal, and his head was full of water”.

To Tacitus, who wrote a biography of his father-in-law, the Roman governor of Britain from AD 77 to 84, Agricola, the whole of Britain north of the Forth-Clyde isthmus was “Caledonia”. However, Tacitus never calls the inhabitants of the country Caledonians, only “Britons”. The geographer Ptolemy, writing in the mid-2nd century (but apparently using data gleaned during Agricola’s tenure), lists the Caledonians (Caledonii) as just one of several tribes living beyond the isthmus. So, although the whole country was called Caledonia, the Caledonians were but one tribe inhabiting that country. (See British Tribes: Caledonia.)
Cassius Dio, discussing events in northern Britain during the period 197–211, notes:
There are two principal races of the Britons, the Caledonians and the Maeatae, and the names of the others have been merged in these two. The Maeatae live next to the cross-wall which cuts the island in half, and the Caledonians are beyond them.Roman History (Epitome, Xiphilinus) LXXVI, 12
It is generally believed that Dio’s “cross-wall” is the Antonine Wall (on the Forth-Clyde line), in which case, the tribes of Caledonia had amalgamated to produce two major groups: the Maeatae, to the immediate north of the Wall, and to the north of them the Caledonians. (See The Caledonian Campaigns of Septimius Severus.)
Almost a century later, in a panegyric delivered in 297, appears the earliest extant mention of the Picts. The anonymous author makes a poetic reference to Julius Caesar having had a relatively easy task invading Britain, since his opponents were:
… an uncivilised nation and accustomed to no enemies except the Picts [Picti] and the Irish [Hiberni], still half-naked …Panegyrici Latini ‘VIII. Panegyric on Constantius Caesar’ §11
A little later, in 310, another panegyric, also anonymous, refers to the:
… forests and marshes of the Caledonians [Caledones] and other Picts[*]…Panegyrici Latini ‘VI. Panegyric on Constantine’ §7
Appended to the Verona List – a list of Roman provinces, dating from about 314 (it survives in a 7th-century manuscript at Verona) – is a catalogue of forty “barbarian peoples that have sprung-up under the emperors”, which begins with the Scots, the Picts and the Caledonians. This is apparently the earliest historical reference to the Scots (Scoti or Scotti), and also the last reference to the Caledonians.
Ammianus Marcellinus, writing about the, so-called, Barbarian Conspiracy of 367:
… at that time the Picts, divided into two tribes, called Dicalydones and Verturiones, as well as the Attacotti, a warlike race of men, and the Scots, were ranging widely and causing great devastation …Res Gestae XXVII, 8
Presumably the Caledonians (Caledonii/Caledones) had evolved into the Dicalydones – the similarity of name is clear – and the Maeatae had metamorphosed into the Verturiones. It would seem, then, that by the early-4th century all the tribes beyond the Forth-Clyde line had come to be known, collectively, as Picti by the Romans. Scoti also seems to be a new name for an old foe – in this instance Irish raiders. The ‘Panegyric on Constantius Caesar’ of 297 linked the Picts with the Hiberni, but thereafter they are always linked with the Scoti. The poet Claudian (Claudius Claudianus), writing in 398, confirms that the Scots are indeed Irish:
… ice-bound Hibernia [Ireland] wept for the heaps of slain Scots.Panegyricus de Quarto Consulatu Honorii Augusti, line 33
(Panegyric on the Fourth Consulship of Honorius)
The etymology of the word Scoti is uncertain – it does not have a Latin root, nor has any proposed Goidelic derivation gained wide acceptance. According to one legend the Scots were named from, Pharaoh’s daughter, Scota – wife of the man who led their forebears from Egypt at the time of Moses.
The origins of the name Pict has been much debated (along with many other aspects of the Picts, who thrived for over five hundred years but about whom remarkably little is known). What they called themselves is not known – the Picts left no literature – but the Latin word Picti would appear to mean ‘painted people’ (pictus = ‘painted’, hence the English word ‘picture’).
Septimius Severus arrived in Britain, to campaign against the tribes of Caledonia (the Maeatae and the Caledonians), in 208. Herodian, a contemporary of Severus, writes:

Most of the regions of [northern] Britain are marshy, since they are flooded continually by the tides of the ocean; the barbarians are accustomed to swimming or wading through these waist-deep marsh pools; since they go about naked, they are unconcerned about muddying their bodies. Strangers to clothing, they wear ornaments of iron at their waists and throats; considering iron a symbol of wealth, they value this metal as other barbarians value gold. They tattoo their bodies with coloured designs and drawings of all kinds of animals; for this reason they do not wear clothes, which would conceal the decorations on their bodies. Extremely savage and warlike, they are armed only with a spear and a narrow shield, plus a sword that hangs suspended by a belt from their otherwise naked bodies. They do not use breastplates or helmets, considering them encumbrances in crossing the marshes.History of the Empire after Marcus III, 14
Almost a century after Severus’ campaigns, the name Pict first appears (297). Another century onwards, in 400, the poet Claudian talks of Britain (in female personification) being:
… clothed in the skin of some Caledonian beast, her cheeks tattooed, and an azure cloak, rivalling the swell of Ocean, sweeping to her feet …De Consulatu Stilichonis II, lines 247–249
(On the Consulship of Stilicho)
And, in 402, of:
… the strange devices tattooed on dying Picts.De Bello Gothico, lines 417–418
(On the Gothic War)
And he had, in 396, referred to:
… the well-named Picts …Panegyricus de Tertio Consulatu Honorii Augusti, line 54
(Panegyric on the Third Consulship of Honorius)
Possibly, then, it was their tendency to decorate themselves with extravagant body-art that caused the Romans to nickname the inhabitants of northernmost Britain Picti: ‘painted people’. On the other hand, maybe the association of tattooing with these British “barbarians” was based not on reality, but on a stereotyped notion of those distant savages. In other words, perhaps it was a myth that the Picts tattooed their bodies. The British cleric Gildas, writing in about 545(?), likens “the terrible hordes of Scots and Picts” to “dark swarms of worms”, and says of them:
Differing partly in their habits, yet alike in one and the same thirst for bloodshed – in a preference also for covering their villainous faces with hair rather than their nakedness of body with decent clothing …De Excidio Britanniae §19
It is difficult to believe that Gildas would have passed-up the opportunity to make disparaging remarks about tattoos if the Picts were particularly noted for them. Perhaps Picti was simply a Latinization of their native name (which could have had a completely different meaning). Nevertheless, the Spanish bishop and encyclopaedist, Isidore of Seville, in the early-600s, wrote:
Some nations lay claim to distinguishing marks not only in clothing but also on their bodies: as we see the curly hair of the Germans; the whiskers and red pigment of the Goths; the tattoos of the Britons. The Jews cut around their foreskin; the Arabs bore holes in their ears; the Getae have yellow hair which they do not cover; the Albanians are resplendent with white hair. Black night possesses the bodies of the Moors; the Gauls have white skin; without horses the Alans are idle. The race of the Picts is not absent from this list, for their name is from their body, which an artisan abuses with tiny needle pricks and the juice of native grass, so it bears things which look like scars – their nobility is spotted with painted limbs.[*]Etymologiae (or Origines) XIX, 23.7
The image of the highly-decorated, naked, Pict still seems to be stuck in the public imagination. Whatever its derivation, it is apparent that Picti was a new collective name for the disparate tribes already living beyond the Forth-Clyde isthmus. According to the mythology that developed, however, the Picts were a migrant race of people who eventually settled in Britain. In the 8th century, the Anglo-Saxon monk and historian, Bede, wrote:
… at first this island had no other inhabitants but the Britons, from whom it derived its name, and who, coming over into Britain, as is reported, from Armorica, possessed themselves of the southern parts thereof. Starting from the south, they had occupied the greater part of the island, when it happened, that the nation of the Picts, putting to sea from Scythia, as is reported, in a few ships of war, and being driven by the winds beyond the bounds of Britain, came to Ireland and landed on its northern shores. There, finding the nation of the Scots, they begged to be allowed to settle among them … The Scots answered that the island could not contain them both; but “We can give you good counsel,” said they, “whereby you may know what to do; we know there is another island, not far from ours, to the eastward, which we often see at a distance, when the days are clear. If you will go thither, you can obtain settlements; or, if any should oppose you, we will help you.” The Picts, accordingly, sailing over into Britain, began to inhabit the northern parts thereof, for the Britons had possessed themselves of the southern. Now the Picts had no wives, and asked them of the Scots; who would not consent to grant them upon any other terms, than that when any question should arise, they should choose a king from the female royal race rather than from the male: which custom, as is well known, has been observed among the Picts to this day.Historia Ecclesiastica Gentis Anglorum I,
Translations:
Claudian by Maurice Platnauer
Cassius Dio Roman History by Earnest Cary
Jerome Adversus Jovinianum by Philip Rance
Gildas De Excidio Britanniae by Hugh Williams
Julius Caesar The Gallic War by T. Rice Holmes
Isidore of Seville Etymologiae by Priscilla Throop
Ammianus Marcellinus Res Gestae by John C. Rolfe
Bede Historia Ecclesiastica Gentis Anglorum by A.M. Sellar
Herodian History of the Empire after Marcus by Edward C. Echols.
Further infomation regarding Pict DNA. Which seems to be R1B.
3% of Irish men hold pictish Dna, r1b. Adding this to the website...so let's date back from there...who were the ancestors of the picts ?
Three percent of men in Northern Ireland and roughly one in 200 men in Ireland carry the DNA ScotlandDNA, an ancestry testing company, discovered a DNA marker that strongly suggests that ten percent of Scotsmen are directly descended from the Picts, the Gaels’ fierce neighbors who battled the Romans. The company’s chief scientist, Dr. Jim Wilson, found a Y chromosome marker among direct descendants of the Picts in 2013. The Scotsman.com reported he said this marker is the “first evidence that the heirs of the Picts are living among us.” The marker is labeled R1b-S530. Read More: DNA tests reunite abandoned brother and sister caught in Northern Ireland divide ScotlandDNA’s managing director Alistair Moffat said about the discovery, “These findings were probably one of the biggest surprises we’ve had in our research. The Picts seem kind of exotic, and different and quite colorful and so I was personally, really, really rather taken with this.” Dr. Wilson tested this marker in more than 3,000 British and Irish men and he found it was 10 times more common in those with Scottish grandfathers than with English grandfathers. 170 Scottish men have been found to carry this marker, though the real number is likely higher. More than 10 percent of 100 Scotsmen tested carried R1b-S530. He said, “As you go up your family tree, there are all sorts of paths. But if we can see that about 10 percent of father-lines look to have a Pictish origin, then we can make the prediction that probably a lot of other lines do too.” ADVERTISING Only 0.8 of English men carry this marker and about 3 percent of men in Northern Ireland carry it. The presence in Northern Ireland may be due to the Scottish plantation in the 16 and 17 centuries. Only 1 of 200 men carried the marker in the Republic of Ireland. Dr. Wilson commented on these differences, “The finding just popped out of the analysis. While there have been hints of this from previous data, what was surprising was the really huge difference between Scotland and England.” Read More: Irish people have far more Viking DNA than was suspected Dr. Wilson is also a senior lecturer in population and disease genetics at the University of Edinburgh. He said, “It is a clear sign that while people do move around there remains a core who have remained at home. Perhaps this was due to farming or that moving around would have to be done on foot.” The Picts were a group of tribes living in the Forth and Clyde beyond the reach of the Romans. They lived near the Britons, Gaels, Angeles, and the Vikings. The Romans called them the “Picti” which means “the painted ones.” They were first mentioned by a Roman chronicler in 300 AD. They fought with the Romans and the Angles and the Picts had overrun the northern frontier of the Roman empire on several occasions by the late 200’s. Previously thought to have “disappeared,” scholars now believe they became assimilated by invading Scots from Ireland.
26th April 2020 The Picts: who really were our mythical ancestors? By Neil Mackay @neilmackay .
Scientists and archaeologists were making huge leaps forward in the understanding of our ancient ancestors before the lockdown began. Here, Writer at Large Neil Mackay, uncovers what we know today about the mysterious and very misunderstood Picts WE think of the Picts as an almost mythological people – mystical, mysterious, barbarian and pagan – lost to us in the mists of time. But nothing could be further from the truth. Before the coronavirus lockdown began, archaeologists were making rapid advances in our understanding of these ancient ancestors. A standing stone carved by Pictish hands some 1,200 years ago was recently discovered near Dingwall, shedding new light on their art and culture. A 1,400-year-old Pictish cemetery was located on the Black Isle, giving us an insight into their religious beliefs and social rituals. In recent years, scholars have been revolutionising how history views the Picts – a people who, until the 1950s, were seen as a subject too fanciful for serious academic study. So who really were the Picts? The broad answer is that they were the inhabitants of Scotland long before the idea of Scotland even existed. They withstood the Roman occupation of Britain, maintaining their own distinct culture while other cultures were subsumed by the Empire. By the Dark Ages, the Picts emerged as a culture just as sophisticated as any other on the British isles at the time. The Picts helped shape modern Britain – and without them Scotland wouldn’t exist. Nor were they stubbornly pagan – they embraced Christianity. Their greatest failing, though, is that they left us no written records beyond the strange hieroglyphics carved onto their standing stones. We still don’t understand what these symbols mean. Other contemporary cultures, however, like the Irish Gaels and the Anglo-Saxons, left plenty of written records. So the void in our understanding of the Picts was filled with either accounts by their neighbours and their enemies, or myths and legends. And so, a faulty understanding of the Picts has existed right up to the present day. Origin story The ancestors of the Picts were the tribes who lived in the north of Scotland, beyond the River Tay. In the first century AD, the Romans called these people Britanni, today we think of them as the Caledonii or Caledonians. These Caledonians defended their land with guerrilla attacks against the legions of Rome. Roman chroniclers such as Tacitus tell us that these tribes forged alliances against Rome – and finally took on the might of the Empire in a huge set piece battle at Mons Graupius in 83AD. The exact location of the battle is unknown but it was probably in Aberdeenshire and gave rise to the name of the Grampian Mountains. The battle was a defeat for the Caledonians but at least two-thirds of their army survived. Resistance, weather, and landscape all made it impossible for Rome to complete its conquest of the entire island of Britain. The north remained free, and the Caledonian ancestors of the Picts continued their hit-and-run campaign against Roman forces.
TREE OF LIFE THE DNA BRIDGE: Paternal & Mitochondrial Dragon DNA explains the importance of the female decent. Mitochondrial DNA is passed only through the female line. Mitochondria is a living sentient and separate life form from ourselves. The mitochondria are dependent on us for life; we live in a symbiotic relationship. Mitochondrial DNA can live 15 generations. 15 generations of living mitochondria live inside you. Your 15 generation grandparents living cells are in you. A mutant mtDNA will drift to fixation in a human matriline in 15 generations. Recently an attempt was made to estimate the age of the human race using mitochondrial DNA. https://drakenberg.weebly.com/dragon-family-tree.html iona millers site on behalf on myself and dad, Nicholas Devere This material is inherited always from mother to children only. By measuring the difference in mitochondrial DNA among many individuals, the age of the common maternal ancestor of humanity was estimated at about 200,000 years. It remains implausible to explain the known geographic distribution of mtDNA sequence variation by human migration that occurred only in the last ~6,500 years. Mitochondrial DNA (mtDNA) (by virtue of its maternal, nonrecombining mode of inheritance, rapid pace of evolution, and extensive intraspecific polymorphism) permits and even demands an extension of phylogenetic thinking to the microevolutionary level. Many species exhibit a deep and geographically structured mtDNA phylogenetic history. Study of the relationship between genealogy and geography constitutes a discipline that can be termed intraspecific phylogeography. ’alien genes’ in human DNA The (Central Asian) Khazar name is derived from Turkic *qaz-, meaning "to wander." The Ashina was considered a sacred clan of quasi-divine status. Q1 actually refers to the subclade Q-P36.2. The Ashina clan, a noble caste, carry the 16q24.3 "red gene" inherited from the Sumerian Annunaki, the root of the Dragon seed that permeates royal lines: Merovingian, Carolingian, Tudor, Plantagenet, Stuart, Hapsburg, Hanoverian, Saxe-Coburg-Gotha, Guelph, Bowes-Lyon, Battenberg (Mountbatten), Guise, and Savoy families - and Transylvanian lineages. The Davidic House of Judah married into the descent of the Merovingian Kings of the Franks. They are connected by a shared bloodline. The dragon archetype rests within the Dragon blood, passed on through the genes. According to Nicholas de Vere, "Briefly, the Dragon lineage starts in the Caucasus with the Annunaki, descending through migrating proto-Scythians to the Sumerians while branching off also into the early Egyptians, Phoenicians and Mittani. A marriage bridge back to Scythia infused the Elvin line of “Tuatha de Danaan” and the Fir Bolg, which branched into the Arch-Druidic, Priest-Princely family to the Royal Picts of Scotland and the ring kings of the Horse Lords of Dal Riada, through the Elven dynasty of Pendragon and Avallon del Acqs, and down to a few pure bred families today." The Royal Court of the Dragon was founded by the priests of Mendes in about 2200 BC and was subsequently ratified by the 12th dynasty Queen Sobeknefru. This sovereign and priestly Order passed from Egypt to the Kings of Jerusalem; to the Black Sea Princes of Scythia (Princess Milouziana of the Scythians) and into the Balkans - notably to the Royal House of Hungary, whose King Sigismund reconstituted the Court just 600 years ago. Sigismund’s assumed descent from Melusine. Her ancestry actually can be traced back to the Scythian Dragon Princess Scota, Queen Sobekh Nefru and the Egyptian Cult of the Dragon. Vlad Dracul was a minion of Sigismund of Luxembourg, and was educated at the Emperor's court in Nuremberg. Dracul was invested into Societas Draconis. The Byzantine Emperor Constantine was a Dragon King. The Byzantine emperor Leo III married his son Constantine (V) to the Khazar princess as part of the alliance between the two empires. Princess Tzitzak was baptized as Irene. Their son Leo (Leo IV) was known as "Leo the Khazar", emperor of the Eastern Roman (Byzantine) Empire from 775 to 780. The re-expansion of paternal group R1b and maternal group H from the Basque Ice Age refuge spread up the coasts of all the countries facing the Atlantic, after the ice melted. The British Isles retained higher rates than the other countries, for several reasons related specifically to early movements directly from the Basque country rather than from general diffusion from western Europe. First, as a result of lower sea levels, the British Isles, in particular Ireland, were connected and at the furthest edge of the extended Ice Age European continent, and thus received the bulk of early coastal migration. Then, as sea levels rose, first Ireland then Britain became islands, relatively insulated from further migration from elsewhere in Europe, thus preserving their high rates of R1b and similarity to the initial settlements. The means by which I could separate the R1b types in the British Isles from those on the other side of the channel is by the use of “Founder Analysis.” That is, looking at the detail of their gene types (so-called STR haplotypes).
These revealed 21 founding clusters, which could only have arrived direct from the Basque country. Their descendant twigs are unique to the British Isles. Rb1 - http://www.familytreedna.com/public/r1b1b2/default.aspx Royal Red Dragons - http://www.youtube.com/watch?v=OnYpMcaHCFI&feature=related King Tut was a Celt - http://wn.com/King_Tut_was_a_Celt

PLoS One. 2015; 10(6): e0128810.
Published online 2015 Jun 8. doi: 10.1371/journal.pone.0128810
Abstract
The importance of the process of Neolithization for the genetic make-up of European populations has been hotly debated, with shifting hypotheses from a demic diffusion (DD) to a cultural diffusion (CD) model. In this regard, ancient DNA data from the Balkan Peninsula, which is an important source of information to assess the process of Neolithization in Europe, is however missing. In the present study we show genetic information on ancient populations of the South-East of Europe. We assessed mtDNA from ten sites from the current territory of Romania, spanning a time-period from the Early Neolithic to the Late Bronze Age. mtDNA data from Early Neolithic farmers of the Starčevo Criş culture in Romania (Cârcea, Gura Baciului and Negrileşti sites), confirm their genetic relationship with those of the LBK culture (Linienbandkeramik Kultur) in Central Europe, and they show little genetic continuity with modern European populations. On the other hand, populations of the Middle-Late Neolithic (Boian, Zau and Gumelniţa cultures), supposedly a second wave of Neolithic migration from Anatolia, had a much stronger effect on the genetic heritage of the European populations. In contrast, we find a smaller contribution of Late Bronze Age migrations to the genetic composition of Europeans. Based on these findings, we propose that permeation of mtDNA lineages from a second wave of Middle-Late Neolithic migration from North-West Anatolia into the Balkan Peninsula and Central Europe represent an important contribution to the genetic shift between Early and Late Neolithic populations in Europe, and consequently to the genetic make-up of modern European populations.
The fundamental question of the relative contribution of Palaeolithic hunter-gatherers and Neolithic farmers regarding the genetic heritage of present-day Europeans has been hotly debated. Three events are believed to have had a major impact in the present-day genetic variability of Europeans: the expansion of modern humans from Africa through the Middle-East some 46.000 years ago, the repopulation of Europe after the Last Glacial Maximum between 27.000 and 16.000 years ago, and the arrival of the Neolithic culture from Anatolia between 9.000 and 5.000 years ago [1].
The studies by Menozzi, Piazza and Cavalli-Sforza on classical genetic markers, more than three decades ago, described a South-East to North-West PC1 component that was interpreted as a demic diffusion of Neolithic farmers from the Middle East into Europe [2–3]. These data were however challenged by DNA analysis from present-day populations ([4–7] among others) and more recently by ancient DNA (aDNA) studies based on mitochondrial DNA (mtDNA) [8–23]. aDNA studies of hunter-gatherers revealed a high genetic homogeneity in the pre-Neolithic groups throughout Europe, whether from Scandinavia [8–10], Central Europe [11] or the Iberian Peninsula [12–13]. The analysis of aDNA from Early European farmer groups of the Linear Pottery Culture (LPC, also known as Linienbandkeramik Kultur or LBK) in Central Europe suggested a genetic discontinuity in Central Europe and favored instead of a process of Neolithic transition through a demic diffusion model (DD) [14–15]: this view was based on a high frequency of the N1a haplogroup (about 15%) in the LBK farmers [15], absent in hunter-gatherers in this same region [11] and almost nonexistent (0.2%) in the present-day European populations [15]. On the other hand, these first farmers shared an affinity with the modern-day populations from the Near East and Anatolia, supporting a major genetic input from this area during the advent of farming in Europe [15]. Studies of other Neolithic sites in the North of France, Hungary and the Northeast of Iberian Peninsula also supported this view [16–18]. However, an ancient mtDNA study of a Neolithic site in the Mediterranean region of Europe, namely in the Iberian Peninsula, led to the proposal of a dual model for explaining the Neolithic dispersion process in Europe: DD in Mediterranean area and CD in Central Europe [19].
On the other hand, it has also been proposed that the mtDNA variability in the Cantabrian Fringe (nine archaeological sites of both Hunter-Gatherers and Farmers) is best explained by a model of random rather than clinal dispersal of Neolithic farmers in Europe, with different genetic influence in different geographical regions and in different periods of time [12]. In regard to Central Europe, a comprehensive study on mtDNA from archaeological sites spanning from the Early Neolithic to the Early Bronze Age identified four marked genetic shifts during the Neolithic period. This diachronic study reported a marked genetic shift between the Early/Middle and Late Neolithic populations, with a key role for Late Neolithic cultures in shaping the genetic diversity of modern central Europe genetic diversity [21]. How did this marked genetic shift between Early/Middle and Late Neolithic could occur in a relatively limited period of time is unclear.
Additionally, a recent mtDNA study on a sample of 15 Near Eastern farmers has revealed genetic affinities between these earlier farmer communities and modern populations from Cyprus and Crete, suggesting that the Neolithic was first introduced into Europe through pioneer seafaring colonization [22].
Finally, the study of the genomes of a 7,000-year-old farmer from Germany and eight ~8,000-year-old hunter-gatherers from Luxembourg and Sweden have shown that most present-day Europeans derive from at least three highly differentiated populations. Besides, authors have proposed that early European farmers had a ~44% ancestry from a ‘basal Eurasian’ population [23].
While much has been learned by the aforementioned studies, two crucial aspects have not been taken into consideration. Firstly, archaeological data show that the Neolithic expansion from Anatolia was not a single event but was represented by several waves of migrants [24]. In this respect the Proto-Sesklo culture in Greece, from which directly Starčevo-Criş in the North Balkans and indirectly LBK in Central Europe originate [25–26] represents only the first great wave of Neolithisation of Europe [27]. A later great wave of migration from North-West Anatolia led to important cultures of South-Eastern Europe such as Vinča and Boian cultures [28]. Secondly, there is a total absence of aDNA data from South-East Europe in the current models.
In the present study we have assessed the mtDNA variability from 63 individuals recovered from 10 archaeological sites in Romania spanning a period of five and a half millennia (c. 6300–1100 cal BC) between the Early Neolithic to the Late Bronze Age in Romania (Table 1, Fig 1). This is a strategic area of South-East Europe, from which different prehistoric human groups have passed and later spread throughout Europe. These sites encompass several major cultural events: i. the first Neolithic complex of the Gura Baciului- Cârcea group (also called Precriş culture) of Starčevo-Criș culture, which has the same origin in the Proto-Sesklo culture and it is partially contemporary with LBK culture in Central Europe; ii. the Boian, Zau and Gumelniţa cultures, that represent a continuum of a second migration in the Middle/Late Neolithic and Eneolithic, which has its origin in North-West Anatolia (Demircihoyuk) through East Bulgaria [28–29]; iii. the Eneolithic complex of Decea Mureşului, that represents a possible eastern migration [30–32]; and iv. the Early and Late Bronze Age complex of Floreşti-Polus, that represents new migratory movements most likely originating in the North steppes of the Black Sea [29]. The aim of the study is to shed light on the genetics of the different waves of migration of Neolithic and Bronze Age populations penetrating Europe from Anatolia and the steppes north of the Black Sea. We also assess the genetic impact of prehistoric events in the genetic composition of the present-day European populations.
Prehistoric samples from Romania analysed in the present study: Chronology, Cultural stages (also in Supporting Information S1 Table), Archaeological sites and Sample size (I.D.: Identification name; N analysed: Number of individuals analysed; N rep: number of individuals with reproducibility results).Chronology and cultureSiteI.D.N analysedN repEarly Neolithic (E_NEO) (6500–5500 BC) (Cârcea/Gura Baciului/Precriş Culture)Gura BaciuluiGB22NegrileştiNE11CârceaCA22Middle/Late Neolithic and Eneolithic (M_NEO) (5500–4500 BC) (Boian-Zau and Gumelniţa cultures)IclodI33VărăştiVa/BV1414CurăteştiCu22Sultana-Valea OrbuluiSu1612Sultana-Malu RoşuSMR1010Eneolithic (Eneol) (4500–3800 BC) (Decea Mureşului culture)Decea MureşuluiDM22Early Bronze Age (E_BA) (2600–2100 BC) (Copăceni culture)Floreşti-PolusP22Late Bronze Age (L_BA) (1500–1100 BC) (Noua culture)Floreşti-PolusP99Open in a separate window Open in a separate windowFig 1Geographic location of ten Romanian sites analyzed in the present study.
(The figure has been provided by M. Rotea and T. Károly).
Ancient DNA analysis was performed from 80 teeth remains belonging to 63 individuals recovered from ten prehistoric sites (Table 1, Fig 1 and S1 Table). We have performed 14C dating for eleven human remains from six Romanian sites (S8 Fig). One of the samples was discarded because it provided inconsistent dating, while the others were consistent with the archeological dating. Fifty nine informative mtDNA sequences were obtained from a total of 63 individuals, accounting for an overall efficiency of 93% (4 individuals were discarded due to inconsistent results) (S2 Table, Supporting Information). A number of individuals (17%) has been replicated independently, which consisted in performing the extraction, amplification and sequencing of two samples from the same individual by different researchers at different periods of time. The number of molecular targets was quantified for each extract by means of RT-qPCR. The results showed that the number of molecules/μl in the extracts ranged between 200–66000 (S2 Table), values falling within the limits proposed for reliable aDNA studies [33].
In order to identify any possible contamination that might have occurred in the different stages of the laboratory work, at least two extraction controls and several PCR negative controls were included in each amplification reaction. The rate of contamination for this analysis was 1.3%.
In addition, a total of 192 PCR products from 26 individuals were cloned, of which a minimum of ten clones per PCR product were selected and sequenced (S6 Table). The results were used to determine the degree of coincidence between the consensus sequence of the clones and the sequence obtained by direct sequencing. A mean of 8.20 mutations per fragment cloned (~100 pb) were rejected as these mutations were found uniquely in different clones. These mutations have been considered as artefacts resulting from post-mortem damage to aDNA.
The mtDNA variability observed in the samples from Early Neolithic in Romania (E_NEO) (n = 5, Gura Baciului, Negrileşti, and Cârcea sites), showed five haplotypes (haplotype diversity = 0.99±0.0395) that were assorted into four European haplogroups (H, HV, J and T1a) (Table 2). The haplogroup H is the most frequent in the present-day European populations and the haplogroups J and T1 are suggested to be as markers of the Neolithic diffusion from Near East [5].
Haplotype (ht) and haplogroup (hg) mtDNA distribution resulting of the analysis of 62 ancient individuals from Romania.ChronologySampleht%hg%Early Neolithic (E_NEO)GB2ht120J20GB3ht220HV20NE-1ht 4220H40Ca1ht1620HCa2ht1720T1a20Middle/Late Neolithic and Eneolithic (M_NEO)BV1; Va4; Va8; Su7; Su12; Su16; Su9; SMR-1; SMR-3; SMR-6; SMR-8ht1627H58.5BV2ht182.4HVa3ht212.4HVa6ht232.4HVa11ht272.4HVa12ht282.4HSu11; SMR-5ht334.8HSu14ht352.4HSu15ht362.4HSMR-4ht382.4HSMR-7ht392.4HSMR-9ht402.4HSMR-10ht412.4H2Cu1ht122.4U512.2Su3ht132.4U5Su13ht342.4USu1ht302.4U4Su8ht322.4U5bI8; I9ht44.8J12.2Va2ht202.4JVa5ht222.4JVa9ht252.4JCu2ht292.4K4.8Su4ht312.4KVa1ht192.4T14.8I6ht32.4T1aVa7ht242.4W2.4Va10ht262.4HV02.4SMR-2ht372.4R2.4Eneolithic (Eneol)DM3ht550K100DM4ht650KEarly Bronze Age (E_BA)P11ht750K100P12Aht750KLate Bronze Age (L_BA)P24ht912.5H137.5P25ht1012.5HP30ht1512.5HP26ht1112.5HV25P29ht1412.5HVP27ht1212.5U525P28ht1312.5U5P22; P23*ht812.5W12.5Open in a separate window
(* only considered one sample).
The sample of this chronological sequence from Romania is represented by 41 individuals from five different sites. Boian culture (c. 5300–4500 cal BC) can be framed in the Middle Neolithic period, while Gumelniţa (c. 4500–4000 cal BC) corresponds to the final stage of the Neolithic in Romania, called Eneolithic (also known as Chalcolithic or Copper Age) [28]. Gumelniţa and Boian are two related cultures, having the same area, same type of settlements, economy and burials, being only different in their chronology. Most archeologists believe that these two cultures represent a continuum [28, 34]. The samples from the Iclod site belong to the Zau culture (who is contemporary with both Boian and Gumelniţa). Therefore, we decided to analyse the samples belonging to Boian, Gumelniţa and Zau cultures together: for the sake of simplicity we will call them M_NEO during the population genetic analysis. In addition, no statitically significance differences were found between these sites, supporting the decision to analyse them together. The analysis of their mtDNA variability showed 29 mitochondrial haplotypes (haplotype diversity = 0.8095±0.0052), which were assorted into eight different haplogroups (H, HV, R, J, K, T, U, W) (Table 2). The most frequent is haplogroup H (58.5%), which showed a high diversity including 13 different haplotypes, while the next most frequent haplogroups were U (12.2%) and J (12.2%). Within haplogroup U five different haplotypes can be seen, with four of them corresponding to the subhaplogroups that were frequent in the European hunter-gatherers (U5 and U4). The haplogroups J and T (T1), which have been proposed as genetic markers of the Neolithic demic diffusion from the Near East [5], showed a frequency of 12.2% and 4.8% respectively. These values are similar to those found in modern European populations, and the same was true for the rest of the haplogroups (K, W, HV, R).
The samples of Eneolithic in Romania were obtained from two individuals recovered from the Decea Mureşului site (samples identified as Eneol) and belonging to a cultural phenomenon known under the same name. Generally, archaeologists consider that the Decea Mureşului culture is the result of a migration of non-indigenous populations coming from the North Pontic steppes [31]. The material culture of these intrusive communities differs fundamentally from that of the local Eneolithic cultures (e.g. Boian, Gumelniţa, Petresti, Cucuteni, Tiazapolgar, etc.) [28]. This is the reason why the samples of the Decea Mureşului culture were analysed separately of other cultures from the same chronological sequence (e.g. the local Gumelniţa culture).
The two different mitochondrial haplotypes obtained in two individuals recovered from the Decea Mureşului cemetery correspond to haplogroup K. These haplotypes are unique, not found in any prehistoric sample, either Romanian or European (Table 2). These mitochondrial DNA haplotypes have only been found, albeit with a low frequency, in the present-day Middle East populations (1%).
The two individuals from the Copăceni group, an Early Bronze Age site (E_BA), showed two different haplotypes, which are included in haplogroup K. These haplotypes are common in present-day and ancient European populations. On the other hand, the mtDNA data obtained from Noua Culture, a Late Bronze Age site (L_BA) in Romania, correspond to eight different haplotypes (haplotype diversity = 0.8889±0.0074), assorted into four European haplogroups (H, HV, U5 and W) (haplogroup diversity = 0.8214±0.1007). It should be highlighted that the haplotypes ht12 and ht13 in the L_BA site, belonging to subhaplogroup U5 (one of the most ancient in Europe) were also found in the Middle-Late Neolithic (M_NEO) groups from Romania (Table 2). One of the haplotypes (ht8 corresponding to haplogroup W) was found in two different individuals in the L_BA site (P22 and P23) (Table 2). As archaeological and anthropological context suggested a possible kinship relation between these two individuals, the analysis of five autosomic STRs in the samples was performed (AMG, D13S317, D2S1338, D18S51, D16S5399 AmpFlSTR MiniFiler PCR amplication Kit, Life Technologies); this genetic analysis confirmed that they likely were sister and brother (initially called “Romeo and Juliet” as they were thought to be a young couple of lovers [35]) (S2 Table). For this reason, only one of these two individuals has been included in the diversity and statistical analysis.
A pairwise Fst test based on the mitochondrial haplotype variability showed significant differences between ancient (present study) and modern Romanian populations [36] (S3 Table). No conclusions can be drawn for Eneol and E_BA populations due to the small sample size of those groups (n = 2). When the analysis was performed on the mitochondrial haplogroup variability, the M_NEO and present-day Romania (ROM) populations did not show statistical differences. Analysis of Median Joining Network within prehistoric Romanian populations (presented in the S1 Fig), showed that the most frequent haplotype was rCRS (the central node in the Network, ht16 in Table 2), that was shared by individuals from the Early Neolithic (E_NEO), Middle/Late Neolithic and Eneolithic (M_NEO) and present-day (ROM) groups. Two other shared haplotypes in this network were the 16270 (ht13, U5 in Table 2) and 16192–16270 (ht12, U5 in Table 2), polymorphisms that appeared in M_NEO and L_BA groups. The rest of the haplotypes are specific to each archeological/cultural group.
As it can be seen in the network (S1 Fig), the higher haplotype diversity corresponded to mtDNA lineages from Middle/Late Neolithic and Eneolithic (M_NEO), where haplogroup H presented a high frequency and diversity values (S1 Fig). Therefore, a network including the haplotypes of both the M_NEO and the present-day Romanian [36] populations was built in order to analyze the mtDNA variability shared by these two populations (S2 Fig). It can be observed that most of the shared polymorphisms belong to haplogroup H.
The first Neolithic inhabitants of Europe are described archeologically as belonging to the Aegean Early Neolithic cultures [27], from which the bearers of both the Starčevo-Criş-Körös complex in Serbia, Romania and Hungary [28, 37] and the Linear Pottery culture in Central Europe (LBK) [21] emerged. No statistical significant differences were found between mtDNA frequency distribution of these two cultures which is in line with the archaeological evidence of a common origin in the Sesklo cultural complex. It is noteworthy to observe that the haplogroup N1a found in the individuals of LBK culture and which is considered a hallmark of the Early Neolithic populations in Central Europe was absent in the Starčevo-Criş culture groups; however, a bias due to the low number of Early Neolithic samples from Romania cannot be excluded as a cause for this difference (S3 Fig).
The population corresponding to the Boian, Zau and Gumelniţa cultures from Romania studied here (n = 41) was compared with populations of Central Europe represented by the Baalberge, Salzmünde and Bernburg cultures [21], because of their chronological proximity. The S4 Fig shows that both groups share similar frequencies for haplogroups J, R, U and W, whereas important differences were found for haplogroups H (58.5% in Romania and 22% in Central Europe), K (4.8% and 17% respectively) and T (4.8% and 14.8% respectively). Haplogroups N and X were absent in the Middle/Late Neolithic and Eneolithic (M_NEO) Romanian population. This led to statistically significant differences between Romanian and Central European Neolithic populations for both mtDNA haplogroups and haplotypes (p = 0.00000±0.0000). Median Joining Network analysis of the mtDNA haplotypes of M_NEO groups from Romania and Central Europe displayed differences in their haplotypes distributions (S5 Fig). The only shared polymorphisms are those corresponding to the rCRS (central node of the Network) and polymorphisms 16069 (haplogroup J) and 16298 (haplogroup HV).
The mitochondrial haplotypes obtained in two individuals recovered from the Decea Mureşului site belonged to haplogroup K (Table 2). Therefore, we have performed a Median Joining Network for this haplogroup (S6 Fig), which includes all haplotypes corresponding to the ancient populations of Romania (present study), Czech Republic (Vedrovice) [38], Near Eastern [22], as well as present-day populations (Romania, Near Eastern and Eastern Europe). The network showed that the only shared polymorphisms between Decea Mureşului samples and the rest are those of the central node and two other polymorphisms shared with ancient and modern Near Eastern populations.
Important population shifts due to migratory events coming especially from the East occurred in the Bronze Age on the present territory of Romania. The Early Bronze Age II phase of Florești-Polus site is represented by a novel culture (Copăceni group) characterized by the presence of tumuli and megaliths, and associated with the Yamnaya culture from the Crimea/Volga basin [29, 35]. From this stage, only two individuals were available, who showed the same haplogroup K. In contrast, the late phase of Florești-Polus site represents a new migration event related to the Noua-Sabatinovka culture [29, 35]. Therefore we compared the mtDNA haplogroup frequency of L_BA individuals from Polus with a Bronze Age group from Ukraine [39] (S7 Fig). These two Bronze Age populations shared haplogroups H, U and W, with the largest differences referred to the frequency of haplogroup W. The Bronze Age Ukraine population presented the highest mtDNA haplogroup diversity, due most likely to its large sample size. Significant statistical differences between these groups have not been detected.
We have analyzed the variability of mtDNA haplogroups of ancient Romania groups in the context of other ancient and present-day populations from Europe and Middle East (S4 Table) through two different multivariate analyses: PCA and MDS, Figs Figs22 and and3.3. Eneolithic (Eneol) and Early Bronze Age (E_BA) samples from Romania were excluded due to their small sample size. In Figs Figs22 and and3,3, the Principal Component Analysis (PCA) and Multidimensional Scaling Analysis (MDS) are shown.
 Open in a separate windowFig 2Principal Component Analysis (47% of the total variance) performed considering mtDNA haplogroup frequencies of the ancient and present-day European and Near East populations.
In green Neolithic populations, in pink Hunter-Gatherer groups (HG), in yellow ancient and present-day Romania groups, present-day European population in blue and present-day Near East population in orange. Interpretation based on the haplogroup frequency has been written on both PC (Absence of haplogroups D, M, C and N on one side of the first component and absence of haplogroup H on the top of the second component). PC1 represents 30% of variance and PC2 represents 17% of variance.
 Open in a separate windowFig 3Multidimensional Scaling Analysis performed by haplogroup frequencies of the ancient and present-day European and Near East populations.
In green Neolithic populations, in pink hunter-gatherer groups and in yellow ancient and present-day Romanian groups, present-day European population in blue and present-day Near East population in orange. Stress: 0.07553 and RSQ: 0.99071.
The two first components of the PCA explained 47% of the variance. PC1, representing 30% of the total variance, was related to the haplogroups D, C, M and N (0.962, 0.952, 0.942 and 0.717 respectively). Present-day European populations lay at one end of this axis, the opposite end being associated to the Middle East populations. Prehistoric populations are distributed following a heterogeneous pattern between these two extremes (Fig 2). Early Neolithic (E_NEO) populations from Romania and Central Europe clustered together, while the Middle/Late Neolithic and Eneolithic (M_NEO) population from Romania is not clustered with the Middle Neolithic from Central Europe, but with the modern European populations instead. Overall, a similar conclusion can be inferred from PC2 (17% of the total variance). In this case, the variation is explained by haplogroup H, which had the highest correlation value with this component (0.691). The M_NEO group from Romania showed a high frequency for haplogroup H (58.5%), basically similar to modern Europeans, but different from the Early Neolithic groups from Romania.
Finally, a MDS providing a two-dimensional view of a FST distances matrix was performed. FST values were calculated according to the frequency of the mitochondrial haplogroups. The results of this analysis are shown in Fig 3, with a reliable graphic representation of the genetic distances (RSQ of 0.99071 and Stress of 0.07553). As previously shown, hunter-gatherer populations in Scandinavia [8–10] and Central Europe [11, 21] (HG_SCA and HG_CE) are clearly different from all other populations in the analysis. The Early Neolithic groups from Romania and Central Europe [14–15, 21] (E_NEO_Romania and E_NEO_CE) are close despite differences in haplogroup distribution (S3 Fig). In contrast, the Middle Neolithic groups from Romania and Central Europe [21] (M_NEO_Romania and M_NEO_CE) are separated. In the case of Romania, the M_NEO group had a higher genetic distance from the Early Neolithic (E_NEO_Romania) than with the present-day Romanian population. On the contrary, Early and Middle Neolithic populations in Central Europe [21] lay closer to each other than any of them with the present population of the same area. Lastly, the Late Bronze Age Romanian group is closer to Bronze Age from Ukraine than to the M_NEO_Romania (Fig 3).
In the present study we analysed mtDNA from 59 Neolithic, Eneolithic and Bronze Age individuals recovered from ten archaeological sites in Romania (Table 1), in order to evaluate the potential genetic impact of the different ancient populations in South-East Europe spanning from Early Neolithic to the Late Bronze Age (6300 BC to 1100 BC) on the genetic composition of present-day European populations.
One of the most hotly debated aspects concerning the origin of Europeans is represented by the relative contribution of Palaeolithic/Mesolithic hunter-gatherers versus the Neolithic farmers for the genetic heritage of modern populations. Two major models for the role of Neolithic farmers and the spread of agriculture have been proposed: a demic diffusion (DD) model and a cultural diffusion (CD) model. In the DD model the Neolithic farmers have a much bigger genetic impact on the make-up of modern Europeans than in de CD model. Although early analyses considered only two models, a number of mtDNA studies in Neolithic populations have indicated a more complex pattern for Neolithic transition. Thus, the random dispersion model proposes that Neolithic farmers had a different impact on the various geographic regions (central Europe, Mediterranean Europe and Cantabrian fringe), at different periods of time [12, 17, 20–23].
Studies from Central and West Europe, especially the analysis of mitochondrial diversity of LBK culture groups, showed no continuity between the first farmers of Europe and the modern Europeans, thus proposing that these Neolithic pioneers had little genetic impact on the current European population [11, 14–15, 21]. This hypothesis is supported by our data, which show a close genetic proximity of Early Neolithic group from Romania (Starčevo-Criş culture) with Early Neolithic populations such as LBK but no genetic continuity with modern Romanian populations (Figs (Figs22 and and3,3, S3 Table). These data are in line with the idea of a common origin of the LBK and Starčevo-Criş cultures from the Aegean Neolithic cultures of Northern Greece/Thessaly, the first Neolithic complex in Europe [24]. The differential distribution of the mtDNA haplogroup in both Early Neolithic groups (S3 Fig)—highlighting the absence of N1a lineage in E_NEO_Romania, a Neolithic marker in Central Europe—may reflect a differential genetic impact of the Neolithic pioneers in these areas.
A comprehensive study of mtDNA spanning a period from the Early Neolithic to the Bronze Age in Central European populations has been recently completed [21]. In this study, by comparing different Neolithic populations of Central Europe with a Central European metapopulation, the authors proposed four major demographic events. Their analysis supported a model of continuity between Late Neolithic and modern European populations, while Early and Middle Neolithic populations showed a limited genetic impact in this region. A similar genetic shift has been identified by an exhaustive analysis based on haplogroup H [40], showing a minimal genetic continuity between Early Neolithic and Middle/Late Neolithic groups in Central Europe, which the authors consider ‘a previously unrecognised major genetic transition’ [40].
Several scenarios have been proposed to account for this genetic shift between Early/Middle and Late Neolithic in Central Europe, suggesting an influence of the CWC (Corded Ware culture) from the East and of the BBC (Bell Beaker culture) from the West in the Late Neolithic. The impact of people of the CWC culture, in turn massively influenced by a possible influx of populations from the East from the Yamnaya culture, has been proposed to be especially important [41]. While this idea is certainly possible, none of the models studied to date have taken into consideration another possible and obvious explanation, namely a new wave of Neolithic migration into Europe through the ‘traditional route’ of the Balkan Peninsula. This new wave of Neolithic migrations are represented by Vinča and Dudeşti cultures (5500–5000 BC), that trace their origin in North-West Anatolia on the basis of ceramics features [28]. The Boian, Zau and Gumelniţa cultures from Middle-Late Neolithic (M_NEO) from Romania are the direct continuation of this cultural complex; the M_NEO group from Romania displayed differences in haplotype (S5 Fig) and haplogroup distributions (S4 Fig) with the Middle Neolithic from Central Europe.
Interestingly, the genetic analysis of a relatively large number of samples of Boian, Zau and Gumelniţa cultures in Romania (n = 41) (M_NEO) identified a close genetic proximity between this Neolithic group and the Eastern and Central extant European populations. This was shown in the multivariate analysis, where M_NEO and modern populations from Romania are very close, in contrast with Middle Neolithic and modern populations from Central Europe (Figs (Figs22 and and3).3). Whereas the genetic analysis of modern populations from Central Europe showed a limited genetic impact of the E_NEO_CE and M_NEO_CE groups in this region [21], the mtDNA data of the M_NEO groups from Romania suggest a high genetic impact on modern population in this region (see S2 Fig for shared polymorphisms). The above mentioned data allow us to suggest that the populations of this putative second wave of Neolithic migration from Anatolia caused a much stronger impact on the genetic make-up of the European populations than the earlier farmers of the Starčevo-Criş and LBK cultures.
This hypothesis is supported by the larger number of archaeological sites for the Middle/Late Neolithic and Eneolithic cultures compared with Early Neolithic cultures in South-East Europe, which indicates higher population numbers [28–29]. It is reasonable to hypothesize an interaction of the Vinča-Dudești and Zau-Boian-Gumelniţa cultures with the Late Neolithic cultures of Central Europe. This would have led to gene flow and permeation in Central Europe cultures of mtDNA lineages from the second great Neolithic migrations of South-East Europe, and may have had an important contribution to the genetic shift between Early and Late Neolithic populations in Europe. The hypothesized contribution of Middle Neolithic migrations from North-West Anatolia into the Balkan Peninsula and Central Europe may explain the position of the BBC (Late Neolithic in Central Europe), close to the M_NEO groups from Romania in the multivariate analysis (Figs (Figs22 and and33).
One last aspect concerns the presence of U haplogroups in four individuals from two of the Middle/Late Neolithic sites: Curatesti and Sultana-Valea Orbului. While it could be argued that these individuals share a genetic background with European hunter-gatherers [42] that interacted with and adopted farmer lifestyles, more genetic studies to include local hunter-gatherer populations and nuclear DNA are needed to discern such a possibility. On the other hand, it should be pointed out that no statistical differences of mtDNA between the Curatesti and Sultana-Valea Orbului sites and the other Middle/Late Neolithic populations from Romania were detected.
Two Eneolithic (Eneol) individuals from Romania have been analyzed, showing the same mitochondrial haplotype (haplogroup K) (Table 2). These haplotypes are unique, not found in any mtDNA database of ancient populations. The network performed with the haplotypes corresponding to haplogroup K (S6 Fig) showed that the two individuals from the Decea Mureşului site shared polymorphisms with the ancient and present-day populations from the Near East. Although the two individuals from Decea Mureşului are associated to the Suvorovo culture from the North-Pontic steppes [29–32], and this has been suggested to represent the first contact between Transylvania and North-Pontic steppes, we have not found genetic evidence in the present study to support this hypothesis.
The archeological data from the Bronze Age in the central Transylvanian plateau of Romania describe at least three major cultures, two of them probably originating and being related to cultures from the East: 1) the Early Bronze Age represented by Copăceni group in the Floreşti-Polus site, which is related to the Yamnaya culture [29]; and 2) the Late Bronze Age complex from Floreşti-Polus site which is related to the Noua-Sabatinovka culture from the North of Black Sea [29]. The most representative number of samples (n = 9) corresponded to the Late Bronze Age (L_BA_Romania). This sample showed a closer genetic similarity with the Bronze Age population from Ukraine than to any other ancient population from Romania. Both FST distance (S3 Table) and multidimensional scaling analysis (Figs (Figs22 and and3)3) showed significant differences between Late Bronze Age and Middle Neolithic from Romania, although both populations shared two haplotypes corresponding to haplogroup U5 (ht12 and 13) (Table 2). These results could reflect the influence of migrations from the East into the Bronze Age population of Romania. On the other hand, the unusual mtDNA haplogroup distribution [(H (37.5%), U (25%), HV (25%), W (12.5%)], described in the L_BA_Romania group and the genetic distance to the modern Romania population (Fig 3), suggest that the contribution of L_BA_Romania to the present-day Romanians was relatively limited. Nevertheless, studies on more individuals are necessary to draw definitive conclusions. Also, the impact of the early Bronze Age migrations on the modern South-East Europeans cannot be assessed in our study, due to the low number of samples.
Finally, in this study we report genetic information on the Neolithic and Bronze Age populations of the Balkan Peninsula, a crucial piece of the puzzle integrating the major demographic and cultural changes that took place from the Neolitic period onwards in South-East Europe. Based on aDNA studies from sites of the Starčevo-Criş culture (Cârcea/Gura Baciului/Negrileşti sites), we confirm their genetic relationship with the LBK culture, both originating in the Proto-Sesklo cultures of Northern Greece. In addition, our data support the strong genetic differences between these first European farmers and the later Neolithic farmers. In addition, we provide for the first time a glimpse to the genetic make-up of the farmers from a later Neolithic migration from Anatolia Vinča and Dudești cultures that later evolved in the Boian, Zau and Gumelniţa cultures in South-East Europe. The strong genetic resemblance of individuals from these cultures with the modern populations leads us to propose the hypothesis that they had an important contribution to the genetic heritage of Eastern and Central Europeans. In contrast, no such influence could be demonstrated for Late Bronze Age migrations.
All in all, these data leads to the hypothesis that the Early to Middle/Late Neolithic genetic transition in South-East Europe was strongly influenced by a second migration of farmers from Anatolia during the Middle Neolithic. This scenario may thus lead to a model in which a cultural diffusion process initially brought into Central Europe by small numbers of farmers of the Starčevo-Criş and LBK cultures was later accompanied by a demic expansion of larger numbers of immigrant farmers of the Vinča-Dudeşti and Boian-Gumelniţa cultures. Additional studies are needed in order to define in detail the Neolithic processes of migration in South-East Europe, including an assessment of the local Mesolithic populations, and a more extensive study assessment of Neolithic and Bronze Age Balkan cultures.
A mtDNA analysis of a total of 63 individuals recovered from ten sites located in Northern and Southern Romania was carried out; the chronology of these sites ranges from Early Neolithic to the Late Bronze Age. The Early Neolithic (6500–5500 cal BC) sites of Cârcea (Dolj county), Negrileşti (Galaţi county) and Gura Baciului (Cluj county) are associated to the Starčevo-Criş culture (VI millennium BC). Another five sites correspond to Middle/Late Neolithic and Eneolithic period (5500–3800 cal BC): Iclod (Cluj county), Vărăşti (Călăraşi county), Curăteşti (Călăraşi county), Sultana-Malu Roşu (Călăraşi county) and Sultana-Valea Orbului (Călăraşi county). The Late Eneolithic period (4500–3800 BC) is represented by Decea Mureşului site (Alba county), and finally the Bronze Age period by the site of Floresti-Polus (Cluj county). These ten sites were put into several cultural and chronological groups, in order to characterize changes in the mtDNA variability from Early Neolithic (E_NEO) to Late Bronze Age (L_BA) (Fig 1 and Table 1, S7 Fig).
Five individuals from the Early Neolithic Romania period come from three sites: 1) Cârcea site is located on the banks of the Cârcea River. Most of the human bones were found in the settlement's "defense ditch" and they were among ceramic fragments and animal bones [43]. 2) Negrileşti is a grave found at 2.90 m depth. The skeleton lying on the right side with bent legs carried on the abdomen and the chest a deposit of snails and a stone [44]. 3) Gura Baciului burials consisted of an inhumation and incineration pit where seven skeletons were inhumated in a bent position [45–46].
Forty-five samples from individual graves have been recovered from five Middle and Late Neolithic sites. From geographical point of view most of these sites are placed in southeaster area of Romania, near Danube River (Vărăşti) or on the high terrace of Mostiştea Lake (Curăteşti, Sultana-Malu Roşu, Sultana-Valea Orbului). The only exception is the Iclod cemetery that is located in Transylvania, on the banks of the Someşul Mic River. In terms of cultural framework, Iclod cemetery belongs to Zau culture [47–48]; Curăteşti and Sultana-Valea Orbului to Boian culture [49], and Vărăşti and Sultana-Malu Roşu are settlements belonging to Boian and Gumelniţa communities using the same cemetery[49].
This period is represented by Decea Mureşului site (Alba county), dated in the end of the 5th millennium BC. Samples for mtDNA analysis were taken from two of the discovered graves. Exceptional grave goods and the use of ocher and stone mace-head, represent the first contact (migration) between Transylvania and North-Pontic steppes [50].
Two samples were taken from the great barrow/tumulus from Floresti-Polus (Cluj county) [51–52]. This funerary complex belongs to Copaceni group, dating from the period II of the Early Bronze Age in Transylvania. The Yamnaya culture (Pit-Grave culture) [53–54], that influence this group, appears at the end of 4th millennium BC in the north steppes of the Black Sea [55] and, later it cover a large area to the west, including Transylvania.
Nine samples for mtDNA analysis come from eight graves from Floresti-Polus (the largest necropolis of Noua culture from Transylvania) [51]. The local populations contributed to cultural genesis of this archaeological complex (Monteoru and Komarov cultures from Moldavia and some eastern contribution—most often attributed to the Iranian people (ancestors cimirienilor, scythians) who, in the second millennium BC dominated a Ponto-Caspian steppes) [56].
The processing of the ancient samples in the laboratory involved the application of a series of strict criteria for the authentication of results, detailed in [57–60]. In our case, the extraction and preparation of the PCR was undertaken in a specific lab for aDNA, which consist in a positive-pressure sterile chamber, located in a physically separated space from the laboratory where post-PCR processes are carried out. All the work surfaces were cleaned regularly with sodium hypochlorite and irradiated with UV light. Suitable disposable clothing was worn (lab coat, mask, gloves and cap). Contamination controls were applied in both the extraction and amplification processes.
Selection of samples for performing the present study was made from teeth without caries or deep fissures that might extend into the pulp. Whenever possible, more than one tooth was taken from each individual for duplicate analysis, with the duplicates being analysed in various sessions by different researchers at the University of the Basque Country (UPV/EHU).
In order to eliminate surface contamination, the teeth were subjected to a process of depurination using acids, and the entire surface was irradiated with ultraviolet light [61]. The extraction process followed the protocol described by [62]: the tissue (root of the tooth or powdered bone) was incubated with stirring for 2 hours at 56°C in a lysis buffer (5 ml) (0.5 M EDTA pH 8.0–8.5; 0.5% SDS; 50 mM Tris HCl pH 8.0; 0.01 mg/ml proteinase K). The DNA was recovered using phenol and chloroform and then concentrated and purified (Centricon-30, Amicon). Each extraction session involved two contamination controls that were applied to the entire process, except no dental or bone tissue was added.
Sequencing of HVR-I [nucleotide positions (nps) 15,998–16,400] and HVR-II (nps 16504–429) as per [63], was undertaken in six overlapping fragments, each with a length of approximately 100 bp (base pair). Besides, the fragment between primers 8F and 8R [12] was amplified in all samples to determine position 73 of HVR-II of the mtDNA. The amplification of each fragment was undertaken in independent PCRs. In the case of positive amplification and the absence of cont

The Genetic Journey of Pakistan The “Genetic Journey of Pakistan” illustrates how the genetic makeup of Pakistan’s various ethnic groups was forged by successive waves of immigration from Central Asia and South Asia since the end of the last Ice Age. Throughout its long ancient history, the Indus Valley has been known welcome different peoples, faiths and cultures. The Indus was a region that our early human ancestors encountered soon after they left Africa between 50,000 to 70,000 years ago. Evidence of these early humans can be found throughout Pakistan today at Soan, Riwat, Makli Hill, Bajaur and Sanghao. Approximately 9000 years ago they began establishing cities such as Mehrgarh, which eventually expanded to represent the Harappan culture (Indus Valley Civilization) in 3000 BCE, rivaling the early city-states of Mesopotamia. Shortly after the fall of the Harappan civilization in 1500 BCE, a massive migration is said to have taken place from Eurasia to the Indus Valley, known today as the Aryan migration theory. This eventually led to the formation of the Vedic civilization by 1200 BCE. After 500 BCE, the Indus Valley would come under the influence of the Achaemenid Persians, Alexander’s Macedonian Empire, Greeks, Buddhists (Mauryans), Central Asians (Sycthians, White Huns), Mongols, Iranians, Arabs and Turks. It was through these various influences by which our nation would be forged into its multi ethnic society today. Pakistanis are divided genetically into 11 distinct groups: Baloch, Brahui, Burusho, Hazara, Kalash, Kashmiri, Makrani, Parsi, Pashton, Punjabi and Sindhi. Other groups are also being investigated at present such as the Kho (Chitrali) and Baltis. The studies show that these ethnic groups share about 40% to 60% of their DNA with South Asians, about 40% to 60% with Eurasians and about 20% to 40% with East Asians, West Asians or Sub-Saharan Africans. These percentages vary between various ethnic groups and subgroups. ~ Kalash people ~ The Kalash people represent an enigmatic isolated population of Indo-European speakers who have been living for centuries in the Hindu Kush mountain range. Genetic analysis of Y-chromosome DNA (Y-DNA) by Firasat et al. (2007) on Kalash individuals found high and diverse frequencies of these Y-DNA Haplogroups: L3a (22.7%), H1* (20.5%), R1a (18.2%), G (18.2%), J2 (9.1%), R* (6.8%), R1* (2.3%), and L* (2.3%). Genetic analysis of Mitochondrial DNA (mtDNA) by Quintana-Murci et al. (2004) stated that "the western Eurasian presence in the Kalash population reaches a frequency of 100%" with the most prevalent mtDNA Haplogroups being U4 (34%), R0 (23%), U2e (16%), and J2 (9%). The study asserted that no East or South Asian lineages were detected and that the Kalash population is composed of western Eurasian lineages (as the associated lineages are rare or absent in the surrounding populations). The authors concluded that a western Eurasian origin for the Kalash is likely, in view of their maternal lineages. A study of ASPM gene variants by Mekel-Bobrov et al. (2005) found that the Kalash people of Pakistan have among the highest rate of the newly evolved ASPM Haplogroup D, at 60% occurrence of the approximately 6000-year-old allele. The Kalash also have been shown to exhibit the exceedingly rare 19 allele value at autosomal marker D9S1120 at a frequency higher than the majority of other world populations which do have it. A study by Rosenberg et al. (2006) employing genetic testing among the Kalash population concluded that they are a distinct (and perhaps aboriginal) population with only minor contributions from outside peoples. In one cluster analysis with (K = 7), the Kalash formed one cluster, the others being Africans, Europeans, Middle Easterners, South Asians, East Asians, Melanesians, and Native Americans. A study by Li et al. (2008) with geneticists using more than 650,000 single nucleotide polymorphisms (SNP) samples from the Human Genome Diversity Panel, found deep rooted lineages that could be distinguished in the Kalash. The results showed them clustered within the Central/South Asian populations at (K = 7). The study also showed the Kalash to be a separated group, having no membership within European populations. The estimates by Qamar et al. of Greek admixture has been dismissed by Toomas Kivisild et al. (2003) stating that "some admixture models and programs that exist are not always adequate and realistic estimators of gene flow between populations ... this is particularly the case when markers are used that do not have enough restrictive power to determine the source populations ... or when there are more than two parental populations. In that case, a simplistic model using two parental populations would show a bias towards overestimating admixture".[41] The study came to the conclusion that the Kalash population estimate by Qamar et al. "is unrealistic and is likely also driven by the low marker resolution that pooled southern and western Asian–specific Y-chromosome Haplogroup H together with European-specific Haplogroup I, into an uninformative polyphyletic cluster 2". A study by Firasat et al. (2006) concluded that the Kalash lack typical Greek Haplogroups such as Haplogroup 21 (E-M35). Previous Y chromosome and mitochondrial DNA markers provided no support for their claimed Greek descent following Alexander’s invasion of this region in 330 BCE, and analysis of autosomal loci provided evidence of a strong genetic bottleneck. The studies show that the Kalash share genetic drift with the Paleolithic Siberian hunter-gatherers and might represent an extremely drifted ancient northern Eurasian population that also contributed to European and Near Eastern ancestry. Since the split from other South Asian populations, the Kalash have maintained a low long-term effective population size (2319–2603) and experienced no detectable gene flow from their geographic neighbours in Pakistan or from other extant Eurasian populations. The mean time of divergence between the Kalash and other populations currently residing in this region was estimated to be 11,800 (95% confidence interval = 10,600−12,600) years ago, and thus they represent present-day descendants of some of the earliest migrants into the Indus Valley from Western Asia. ~ Hazara people ~ The Hazara people sample set showed a total of 189 distinct haplotypes, belonging mainly to West Eurasian (51.72%), East & Southeast Asian (29.78%) and South Asian (18.50%) haplogroups. Compared with other populations from Pakistan, the Hazara population had a relatively high haplotype diversity (0.9945) and a lower random match probability (0.0085). The dataset has been incorporated into EMPOP database under accession number EMP00680. The data herein comprises the largest, and likely most thoroughly examined, control region mtDNA dataset from Hazaras of Pakistan. Genetically, the Hazara are a mixture of western Eurasian and eastern Eurasian components. While it has been found that "at least third to half of their chromosomes are of East Asian origin, PCA places them between East Asia and Caucasus/Middle East/Europe clusters". Genetic research suggests that the Hazaras cluster closely with the Uzbek population, while both groups are at a notable distance from Tajik and Pashtun populations. There is evidence of both a patrimonial and maternal relation to Turkic Peoples and Mongols. Mongol male and female ancestry is supported by studies in genetic genealogy as well, which have identified a particular lineage of the Ychromosome characteristic of people of Mongolian descent ("the Y-chromosome of Genghis Khan"). This chromosome is virtually absent outside the limits of the Mongol Empire except among the Hazara, where it reaches its highest frequency anywhere. These results indicate that the Hazara are also characterized by very high frequencies of eastern Eurasian mtDNAs at 35%, which are virtually absent from bordering populations, suggesting that the male descendants of Genghis Khan, or other Mongols, were accompanied by women of East Asian ancestry. Women of Non-eastern Eurasian mtDNA in Hazaras are at 65% most which are West Eurasians and some South Asian The most frequent paternal Haplogroup type found amongst the Hazara was haplogroup C-M217 at 40% (10/25) with Haplogroup O3 (Y-DNA) at 8% (2/25) both which are Eastern Eurasian males ancestry associated with the Mongoloid ethnicity. ~ Brahui people ~ Brahuis display a variety of Y-DNA haplogroups, the most important being haplogroup R1a1a-M17 (35% to 39.09%) – with its mass diffusion among populations of Central and South Asia and associated with the early eastern migrations of Indo-Iranian nomads. Haplogroup J, which is found among other South Asian people, occurs at 28%. Other, relatively minor, low frequency haplogroups among the Brahui are those of G, L, E1b1a, and N. These haplogroups show that the Brahui population genetics are indistinguishable from those of neighboring Indo-Iranian speakers, in particular of that of the Baloch. Given the high affinity of Brahui to the other Indo-European Pakistani populations and the absence of population admixture with any of the examined Indian Dravidian groups, we conclude that Brahui are an example of cultural (linguistic) retention following a major population replacement. Hence, while the Brahui are ethnically an Indo-Iranian group, they speak a language with a Dravidian origin. ~ Makrani people ~ The Makrani people show a high genetic diversity (0.9688) and, consequently, a high power of discrimination (0.9592). The results revealed a strongly admixed mtDNA pool composed of African haplogroups (28%), West Eurasian haplogroups (26%), South Asian haplogroups (24%), and East Asian haplogroups (2%), while the origin of the remaining individuals (20%) could not be confidently assigned. The analysis also found that the Makranis studied share ancestry with peoples living in modern Kenya, Tanzania (Zanzibar) and South Africa, and with members of the Baloch people. The Asian and African ancestral groups are estimated to have begun mixing genetically about 300 years ago. Owing to their African ancestry, a large proportion of Makranis carry DNA variants common in Africa that protect against malaria infection. ~ Burusho people ~ The Burusho, also known as the Hunza or Botraj, live in the Hunza and Nagar valleys of Gilgit–Baltistan. A variety of Y-DNA haplogroups are seen among certain random samples of people in Hunza. Most frequent among these are R1a1 and R2a, which probably originated in either South Asia, Central Asia or Iran and Caucasus. R2a, unlike its extremely rare parent R2, R1a1 and other clades of haplogroup R, is now virtually restricted to South Asia. Two other typically South Asian lineages, haplogroup H1 and haplogroup L3 (defined by SNP mutation M20) have also been observed from few samples. Other Y-DNA haplogroups reaching considerable frequencies among the Burusho are haplogroup J2, associated with the spread of agriculture in, and from, the neolithic Near East, and haplogroup C3, of Siberian origin and possibly representing the patrilineage of Genghis Khan. Also present at lower frequency are haplogroups O3, an East Eurasian lineage, and Q, P, F, and G. DNA research groups the male ancestry of some of the Hunza inhabitants with speakers of Pamir languages and other mountain communities of various ethnicites, due primarily to the M124 marker (defining Y-DNA haplogroup R2a), which is present at high frequency in these populations. However, they have also an East Asian genetic contribution, suggesting that at least some of their ancestry originates north of the Himalayas. While genetic evidence supports a 2% Greek genetic component among the Pashton ethnic group of Pakistan, it does not support any for the Burusho. ~ Kho people ~ The Kho are an Indo-Aryan ethnolinguistic group associated with the Dardistan region. They speak Khowar (Chitrali), which is a member of the Dardic subgroup of the Indo-Aryan language family. Most Kho people live in the Chitral District of Khyber Pakthunkhwa, while others live in Jammu & Kashmir as well as in Badakhshan. Y-DNA haplogroup R1a (M420) is found at a high frequency among the Kho people. Many are in haplogroup R1b (M343), also found in some Central Asian and South Asian people. ~ Pashton people ~ The Pashton are the composite mosaic of West Eurasian ancestry of numerous geographic origins. They received substantial gene flow during different invasive movements and have a high element of the Western provenance. The most common haplogroups reported in this study are: South Asian haplogroups M (28%) and R (8%); whereas, West Asians haplogroups are present, albeit in high frequencies (67%) and widespread over all; HV (15%), U (17%), H (9%), J (8%), K (8%), W (4%), N (3%) and T (3%). Moreover, we linked the unexplored genetic connection between Ashkenazi Jews and Pashtun. The presence of specific haplotypes J1b (4%) and K1a1b1a (5%) pointed to a genetic connection of Jewish conglomeration in the Khattak tribe. This was a result of an ancient genetic influx in the early Neolithic period that led to the formation of a diverse genetic substratum in present day Pashton. The haplogroup R1a (Y-DNA) is found at a frequency of 51.02% among the Pashtun people. Paragroup Q-M242 (xMEH2, xM378) (of Haplogroup Q-M242 (Y-DNA)) was found at 16.3% in Pashtuns. ~ Sindhi people ~ The study of Sindhis was undertaken to investigate the control region of mitochondrial DNA for forensic discrimination and to explore the ethno-linguistic affiliations among ethnic groups of Sindh. A total of 115 individuals, from six major ethnic/isonym groups, namely, Bijarani, Chandio, Ghallu, Khoso, Nasrani and Solangi, were studied. The most common South Asian haplogroup in six ethnic groups of Sindh, were; M (42%) and R (6.9%), whereas West Eurasian haplogroups were N (6.9%), W (6.9%), J (1.7%), U (23.4%), H (9.5%) and T (0.86%). A random match probability between two unrelated individuals was found to be 0.06%, while genetic diversity varied from 0.991 to 0.998. ~ Punjabi people ~ The study of Punjabis was undertaken to investigate the control region of mitochondrial DNA for forensic discrimination and to explore the ethno-linguistic affiliations among ethnic groups of Punjab. However, only two groups were initially studied – the Arains and Gujars. Punjabi groups are primarily a composite of substantial South Asian, East Asian and West Eurasian lineages. A homogenous dispersal of Eurasian haplogroup uniformity in Punjab was found and exhibited a strong connotation with European populations. Moreover, for the first time the new sub-haplogroup M52b1 was characterized by 16223-T, 16275-G and 16438-A in the Gujar group. The vast array of mtDNA variants displayed in this study suggested that the haplogroup composition radiates signals of extensive genetic conglomeration, population admixture and demographic expansion that was equipped with diverse origin, whereas matrilineal gene pool was phylogeographically homogenous across the Punjab. This context was further fully acquainted with the facts supported by PCA scatterplot that Punjabi population clustered with South Asian populations. Finally, the high power of discrimination (0.8819) and low random match probability (0.0085%) proposed a worthy contribution of mtDNA control region dataset as a forensic database that considered a gold standard of today to get deeper insight into the genetic ancestry of contemporary matrilineal phylogeny. ~ Parsi people ~ Among present-day populations, the Parsis are genetically closest to Iranian and the Caucasus populations. They also share the highest number of haplotypes with present-day Iranians and it is estimated that the admixture of the Parsis with South Asian populations occurred 1200 years ago. Enriched homozygosity in the Parsi reflects their recent isolation and inbreeding. 48% South-Asian-specific mitochondrial lineages among the ancient samples was also observed, which might have resulted from the assimilation of local females during the initial settlement. Most surprisingly, Parsis are genetically closer to Neolithic Iranians than to modern Iranians, who have witnessed a more recent wave of admixture from the Near East. It has been suggested previously that the Islamic conquest had a major genomic impact on several Middle Eastern populations, including Iranians. Since Parsis diverged from Iranians just after this conquest, they may represent the genetic strata of Iran before the Islamic conquest. ~ Sources ~ -Kalash Genetic Isolate: Ancient Divergence, Drift, & Selection by Q. Ayub (2015) -mtDNA sequence diversity of Hazara ethnic group from Pakistan by A. Rakha (2017) -An Ethnolinguistic and Genetic Perspective on the Origins of the Dravidian-Speaking Brahui in Pakistan by L. Pagani (2017) -Separating the post-Glacial coancestry of European and Asian Y chromosomes within haplogroup R1a by P.A. Underhill (2010) -Y-Chromosomal DNA Variation in Pakistan by R. Qamar; Q. Ayub; A. Mohyuddin (2002) -Whole genome sequencing of an ethnic Pathan (Pakhtun) from the north-west of Pakistan by M. Ilyas (2015) -Genetic analysis of mitochondrial DNA control region variations in four tribes of Khyber Pakhtunkhwa, Pakistan by S. Bhatti (2016) -Genetic characterization of the Makrani people of Pakistan from mitochondrial DNA control-region data by M.H. Siddiqui (2015) -Mitochondrial DNA variation in the Sindh population of Pakistan by S. Bhatti (2015) -Genetic perspective of uniparental mitochondrial DNA landscape on the Punjabi population, Pakistan by S. Bhatti (2017) -“Like sugar in milk”: reconstructing the genetic history of the Parsi population by Gyaneshwer Chaubey

Nature Communications volume 8, Article number: 15694 (2017) Cite this article
Egypt, located on the isthmus of Africa, is an ideal region to study historical population dynamics due to its geographic location and documented interactions with ancient civilizations in Africa, Asia and Europe. Particularly, in the first millennium BCE Egypt endured foreign domination leading to growing numbers of foreigners living within its borders possibly contributing genetically to the local population. Here we present 90 mitochondrial genomes as well as genome-wide data sets from three individuals obtained from Egyptian mummies. The samples recovered from Middle Egypt span around 1,300 years of ancient Egyptian history from the New Kingdom to the Roman Period. Our analyses reveal that ancient Egyptians shared more ancestry with Near Easterners than present-day Egyptians, who received additional sub-Saharan admixture in more recent times. This analysis establishes ancient Egyptian mummies as a genetic source to study ancient human history and offers the perspective of deciphering Egypt’s past at a genome-wide level.
Egypt provides a privileged setting for the study of population genetics as a result of its long and involved population history. Owing to its rich natural resources and strategic location on the crossroads of continents, the country had intense, historically documented interactions with important cultural areas in Africa, Asia and Europe ranging from international trade to foreign invasion and rule. Especially from the first millennium BCE onwards, Egypt saw a growing number of foreigners living and working within its borders and was subjected to an almost continuous sequence of foreign domination by Libyans, Assyrians, Kushites, Persians, Greeks, Romans, Arabs, Turks and Brits. The movement of people, goods and ideas throughout Egypt’s long history has given rise to an intricate cultural and genetic exchange and entanglement, involving themes that resonate strongly with contemporary discourse on integration and globalization1.
Until now the study of Egypt’s population history has been largely based on literary and archaeological sources and inferences drawn from genetic diversity in present-day Egyptians. Both approaches have made crucial contributions to the debate but are not without limitations. On the one hand, the interpretation of literary and archaeological sources is often complicated by selective representation and preservation and the fact that markers of foreign identity, such as, for example, Greek or Latin names and ethnics, quickly became ‘status symbols’ and were adopted by natives and foreigners alike2,3,4. On the other hand, results obtained by modern genetic studies are based on extrapolations from their modern data sets and make critical assumptions on population structure and time5. The analysis of ancient DNA provides a crucial piece in the puzzle of Egypt’s population history and can serve as an important corrective or supplement to inferences drawn from literary, archaeological and modern DNA data.
Despite their potential to address research questions relating to population migrations, genetic studies of ancient Egyptian mummies and skeletal material remain rare, although research on Egyptian mummies helped to pioneer the field of ancient DNA research with the first reported retrieval of ancient human DNA6. Since then progress has been challenged by issues surrounding the authentication of the retrieved DNA and potential contaminations inherent to the direct PCR method7. Furthermore, the potential DNA preservation in Egyptian mummies was met with general scepticism: The hot Egyptian climate, the high humidity levels in many tombs and some of the chemicals used in mummification techniques, in particular sodium carbonate, all contribute to DNA degradation and are thought to render the long-term survival of DNA in Egyptian mummies improbable8. Experimental DNA decay rates in papyri have also been used to question the validity and general reliability of reported ancient Egyptian DNA results9. The recent genetic analysis of King Tutankhamun’s family10 is one of the latest controversial studies that gave rise to this extensive scholarly debate11. New data obtained with high-throughput sequencing methods have the potential to overcome the methodological and contamination issues surrounding the PCR method and could help settle the debate surrounding ancient Egyptian DNA preservation8. However, the first high-throughput sequences obtained from ancient Egyptian mummies12 were not supported by rigorous authenticity and contamination tests.
Here, we provide the first reliable data set obtained from ancient Egyptians using high-throughput DNA sequencing methods and assessing the authenticity of the retrieved ancient DNA via characteristic nucleotide misincorporation patterns13,14 and statistical contamination tests15 to ensure the ancient origin of our obtained data.
By directly studying ancient DNA from ancient Egyptians, we can test previous hypotheses drawn from analysing modern Egyptian DNA, such as recent admixture from populations with sub-Saharan16 and non-African ancestries17, attributed to trans-Saharan slave trade and the Islamic expansion, respectively. On a more local scale, we aim to study changes and continuities in the genetic makeup of the ancient inhabitants of the Abusir el-Meleq community (Fig. 1), since all sampled remains derive from this community in Middle Egypt and have been radiocarbon dated to the late New Kingdom to the Roman Period (cal. 1388BCE–426CE, Supplementary Data 1). In particular, we seek to determine if the inhabitants of this settlement were affected at the genetic level by foreign conquest and domination, especially during the Ptolemaic (332–30BCE) and Roman (30BCE–395CE) Periods.
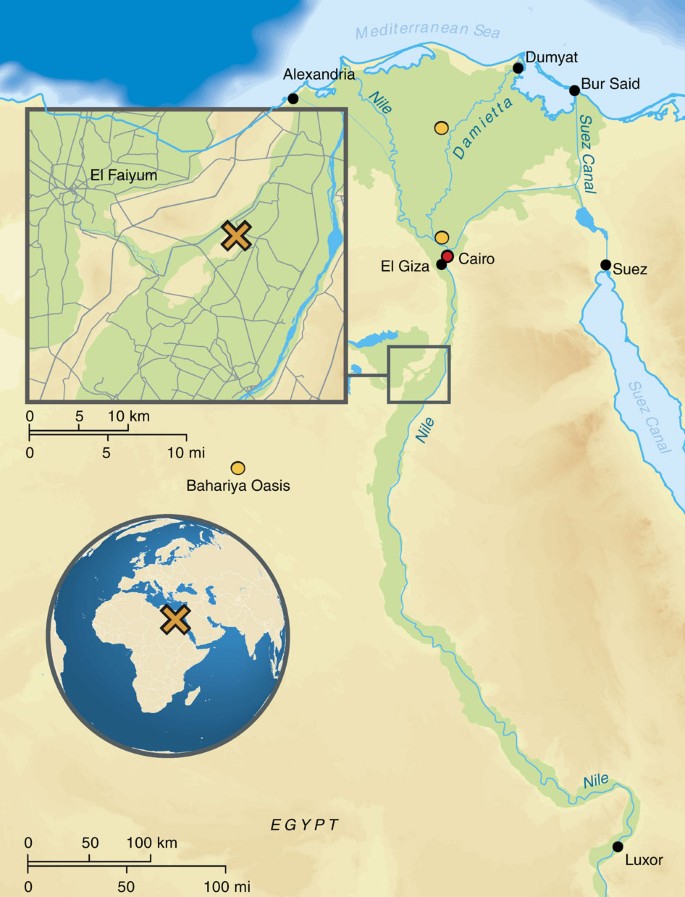 Map of Egypt depicting the location of the archaeological site Abusir-el Meleq (orange X) and the location of the modern Egyptian samples (orange circles) (design of the graphic by Annette Günzel).Full size image
All 166 samples from 151 mummified individuals (for details of the 90 individuals included in the later analysis, see Supplementary Data 1) used in this study were taken from two anthropological collections at the University of Tübingen and the Felix von Luschan Skull Collection, which is now kept at the Museum of Prehistory of the Staatliche Museen zu Berlin, Stiftung preußischer Kulturbesitz (individuals: S3533, S3536, S3544, S3552, S3578, S3610). According to the radiocarbon dates (Supplementary Data 1, see also ref. 18), the samples can be grouped into three time periods: Pre-Ptolemaic (New Kingdom, Third Intermediate Period and Late Period), Ptolemaic and Roman Period. During their conservation in the Tübingen and Berlin collections the remains underwent different treatments: some were preserved in their original mummified state, while others were macerated for anthropological analysis or due to conservation problems19.
In most cases, non-macerated mummy heads still have much of their soft tissue preserved. Some of the remains (individuals analysed in our study: 1543, 1547, 1565, 1577, 1611) have traces of gold leaf near the mouth and the cheekbone, which is characteristic for mummies from the Ptolemaic Period onwards20. In most cases the brain was removed and the excerebration route was highly likely transnasal, resulting in visible defects on the cribriform plate (for the individuals analysed in our study, see Supplementary Data 1). In summary, the excellent bone preservation and the more or less good soft tissue preservation made a wide-ranging analysis possible19.
Recently, various studies were conducted on these remains, including a study on ancient Egyptian embalming resins, two ancient DNA studies and an anthropological examination of the macerated crania12,18,19,21. While the possibilities of a demographic reconstruction based on anthropological finds are naturally limited—due to incompleteness of the assemblage, the following anthropological observations were made on the assemblage: For a first assessment, computer tomographic scans of 30 mummies with soft tissue preservation were produced to describe sex (Supplementary Data 1), age at death (Supplementary Data 1) and the macroscopic health status; the six macerated mummies were examined directly. It is notable that most of the individuals are early and late adults, and that subadult individuals are underrepresented (Supplementary Data 1). It is possible that the sample’s demographic profile is the result of different burial treatments for adults and subadults, but it seems more likely that it is due to collection bias, with collectors favouring intact adult skulls. Almost all of the teeth show significant dentine exposure up to a total loss of the crown. This abrasion pattern is likely due to the food and food preparation itself, in particular for a cereal-rich diet containing a high proportion of coarse sandy particles. These particles act to abrade the dental tissues, allowing bacteria to penetrate the interior of the teeth. As a result, carious lesions or periapical processes appear in the analysed individuals (Supplementary Data 1)19.
For the DNA analysis we sampled different tissues (bone, soft tissue, tooth), macerated and non-macerated, to test for human DNA preservation.
We extracted DNA from 151 mummified human remains and prepared double-stranded Illumina libraries with dual barcodes22,23. Then we used DNA capture techniques for human mitochondrial DNA24 and for 1.24 million genomic single nucleotide polymorphisms (SNPs)25 in combination with Illumina sequencing, through which we successfully obtained complete human mitochondrial genomes from 90 samples and genome-wide SNP data from three male individuals passing quality control.
We tested different tissues for DNA preservation and applied strict criteria for authenticity on the retrieved mitochondrial and nuclear DNA to establish authentic ancient Egyptian DNA. First, DNA extracts from several tissues (that is, bone, teeth, soft tissue and macerated teeth) from 151 individuals were screened for the presence of human mitochondrial DNA (mtDNA) resulting in a total of 2,157 to 982,165 quality filtered mitochondrial reads per sample, and 11- to 4,236-fold coverage. To estimate, identify and filter out potential contamination we applied the program schmutzi15 with strict criteria for contamination and kept only samples with less than 3% contamination for further analysis. For a comparison of different source material (soft tissue, bone and teeth) ten individuals (Supplementary Table 1) were sampled multiple times. Yields of preserved DNA were comparable in bone and teeth but up to ten times lower in soft tissues (Fig. 2a, Supplementary Table 1). Nucleotide misincorporation patterns characteristic for damaged ancient human DNA allowed us to assess the authenticity of the retrieved DNA13,14. The observed DNA damage patterns differed for the source materials with on average 19% damage in soft tissues and around 10% damage in bone tissue and teeth (Fig. 2b,c, Supplementary Table 1). Importantly, mtDNA haplotypes were identical for all samples from the same individuals. Our results thus suggest that DNA damage in Egyptian mummies correlates with tissue type. The protection of bone and teeth by the surrounding soft tissue or the embalmment of soft tissue may have contributed to the observed differences.
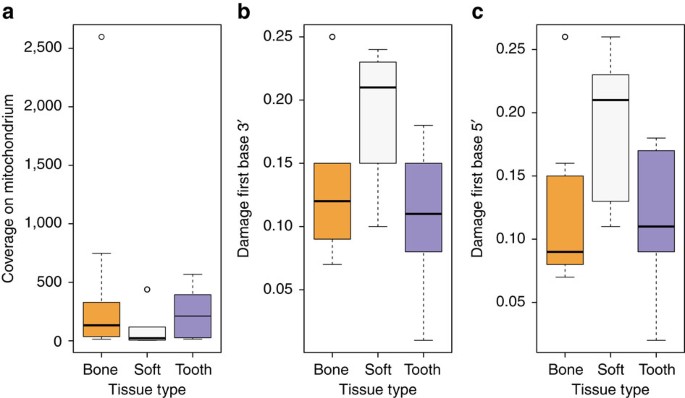 (a) coverage boxplots separated by tissue type (bone, mummified tissue, teeth), (b) boxplots showing damage of first base at the 3′ end separated by tissue type according to a, (c) damage on first base at the 5′ end of mapped reads separated by tissue type according to a and b.Full size image
In order to analyse the nuclear DNA we selected 40 samples with high mtDNA coverage and low mtDNA contamination. Using in solution enrichment for 1.2 million genome-wide SNPs26, we obtained between 3,632 and 508,360 target SNPs per sample (Supplementary Data 2). Overall, the nuclear DNA showed poor preservation compared to the mtDNA as depicted by a high mitochondrial/nuclear DNA ratio of on average around 18,000. In many samples, nuclear DNA damage was relatively low, indicating modern contamination. We sequenced two libraries per sample: one untreated library to assess DNA damage, and one library treated with enzymatic damage repair27, which was used for downstream analysis. We applied strict criteria for further analysis: we considered only male samples with at least 8% average cytosine deamination rates at the ends of the reads from the untreated library, and with at least 150 SNPs on the X chromosome covered at least twice, in order to estimate contamination levels reliably. Three out of 40 samples fulfilling these criteria had acceptable nuclear contamination rates: Two samples from the Pre-Ptolemaic Periods (New Kingdom to Late Period) had 5.3 and 0.5% nuclear contamination and yielded 132,084 and 508,360 SNPs, respectively, and one sample from the Ptolemaic Period had 7.3% contamination and yielded 201,967 SNPs. As shown below, to rule out any impact of potential contamination on our results, we analysed the three samples separately or replicated results using only the least contaminated sample.
The 90 mitochondrial genomes fulfilling our criteria (>10-fold coverage and <3% contamination) were grouped into three temporal categories based on their radiocarbon dates (Supplementary Data 1), corresponding to Pre-Ptolemaic Periods (n=44), the Ptolemaic Period (n=27) and the Roman Period (n=19) (Supplementary Data 1). To test for genetic differentiation and homogeneity we compared haplogroup composition, calculated FST-statistics28 and applied a test for population continuity29 (Supplementary Table 2, Supplementary Data 3,4) on mitochondrial genome data from the three ancient and two modern-day populations from Egypt and Ethiopia, published by Pagani and colleagues17, including 100 modern Egyptian and 125 modern Ethiopian samples (Fig. 3a). We furthermore included data from the El-Hayez oasis published by Kujanová and colleagues30. We observe highly similar haplogroup profiles between the three ancient groups (Fig. 3a), supported by low FST values (<0.05) and P values >0.1 for the continuity test. Modern Egyptians share this profile but in addition show a marked increase of African mtDNA lineages L0–L4 up to 20% (consistent with nuclear estimates of 80% non-African ancestry reported in Pagani et al.17). Genetic continuity between ancient and modern Egyptians cannot be ruled out by our formal test despite this sub-Saharan African influx, while continuity with modern Ethiopians17, who carry >60% African L lineages, is not supported (Supplementary Data 5). To further test genetic affinities and shared ancestry with modern-day African and West Eurasian populations we performed a principal component analysis (PCA) based on haplogroup frequencies and Multidimensional Scaling of pairwise genetic distances. We find that all three ancient Egyptian groups cluster together (Fig. 3b), supporting genetic continuity across our 1,300-year transect. Both analyses reveal higher affinities with modern populations from the Near East and the Levant compared to modern Egyptians (Fig. 3b,c). The affinity to the Middle East finds further support by the Y-chromosome haplogroups of the three individuals for which genome-wide data was obtained, two of which could be assigned to the Middle-Eastern haplogroup J, and one to haplogroup E1b1b1 common in North Africa (Supplementary Table 3). However, comparative data from a contemporary population under Roman rule in Asia Minor, from the Roman city Ağlasun today in Turkey31, did not reveal a closer relationship to the ancient Egyptians from the Roman period (Fig. 3b,c).
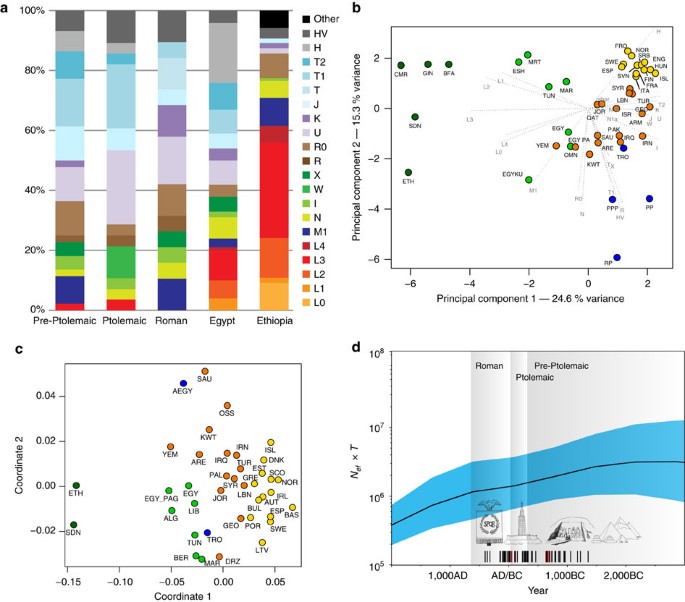 (a) Mitochondrial DNA haplogroup frequencies of three ancient and two modern-day populations, (b) Principal Component Analysis based on haplogroup frequencies: (sub-Saharan Africa (green), North Africa (light green), Near East (orange), Europe (yellow), ancient (blue), (c) MDS of HVR-I sequence data: colour scheme as above; note that ancient groups were pooled, (d) Skygrid plot depicting effective population size estimates over the last 5,000 years in Egypt. Vertical bars indicate the ages of the analysed 90 mitochondrial genomes (three samples with genome-wide data highlighted in red). Note that the values on y axis are given in female effective population size times generation time and were rescaled by 1:14.5 for the estimation of the studied population size (assuming 29-year generation time and equal male and female effective population sizes) (images by Kerttu Majander).Full size image
The finding of a continuous population through time allowed us to estimate the effective population size (Ne) from directly radiocarbon-dated mitochondrial genomes using BEAST32. Our results show similar values of effective population size in the different ancient time periods with an average value of between ca. 48,000 and 310,000 (average 95% CI) inhabitants in the region and period under investigation (Fig. 3d, Supplementary Fig. 2, Supplementary Table 4). This is important as it is the first time that such estimates can be contrasted with reported historic Egyptian census numbers from the neighbouring Fayum in the early Ptolemaic Period, which had a reported total population size of 85,000–95,000 inhabitants33.
On the nuclear level we merged the SNP data of our three ancient individuals with 2,367 modern individuals34,35 and 294 ancient genomes36 and performed PCA on the joined data set. We found the ancient Egyptian samples falling distinct from modern Egyptians, and closer towards Near Eastern and European samples (Fig. 4a, Supplementary Fig. 3, Supplementary Table 5). In contrast, modern Egyptians are shifted towards sub-Saharan African populations. Model-based clustering using ADMIXTURE37 (Fig. 4b, Supplementary Fig. 4) further supports these results and reveals that the three ancient Egyptians differ from modern Egyptians by a relatively larger Near Eastern genetic component, in particular a component found in Neolithic Levantine ancient individuals36 (Fig. 4b). In contrast, a substantially larger sub-Saharan African component, found primarily in West-African Yoruba, is seen in modern Egyptians compared to the ancient samples. In both PCA and ADMIXTURE analyses, we did not find significant differences between the three ancient samples, despite two of them having nuclear contamination estimates over 5%, which indicates no larger impact of modern DNA contamination. We used outgroup f3-statistics38 (Fig. 5a,b) for the ancient and modern Egyptians to measure shared genetic drift with other ancient and modern populations, using Mbuti as outgroup. We find that ancient Egyptians are most closely related to Neolithic and Bronze Age samples in the Levant, as well as to Neolithic Anatolian and European populations (Fig. 5a,b). When comparing this pattern with modern Egyptians, we find that the ancient Egyptians are more closely related to all modern and ancient European populations that we tested (Fig. 5b), likely due to the additional African component in the modern population observed above. By computing f3-statistics38, we determined whether modern Egyptians could be modelled as a mixture of ancient Egyptian and other populations. Our results point towards sub-Saharan African populations as the missing component (Fig. 5c), confirming the results of the ADMIXTURE analysis. We replicated the results based on f3-statistics using only the least contaminated sample (with <1% contamination estimate) and find very similar results (Supplementary Fig. 5), confirming that the moderate levels of modern DNA contamination in two of our samples did not affect our analyses. Finally, we used two methods to estimate the fractions of sub-Saharan African ancestry in ancient and modern Egyptians. Both qpAdm35 and the f4-ratio test39 reveal that modern Egyptians inherit 8% more ancestry from African ancestors than the three ancient Egyptians do, which is also consistent with the ADMIXTURE results discussed above. Absolute estimates of African ancestry using these two methods in the three ancient individuals range from 6 to 15%, and in the modern samples from 14 to 21% depending on method and choice of reference populations (see Supplementary Note 1, Supplementary Fig. 6, Supplementary Tables 5–8). We then used ALDER40 to estimate the time of a putative pulse-like admixture event, which was estimated to have occurred 24 generations ago (700 years ago), consistent with previous results from Henn and colleagues16. While this result by itself does not exclude the possibility of much older and continuous gene flow from African sources, the substantially lower African component in our ∼2,000-year-old ancient samples suggests that African gene flow in modern Egyptians occurred indeed predominantly within the last 2,000 years.
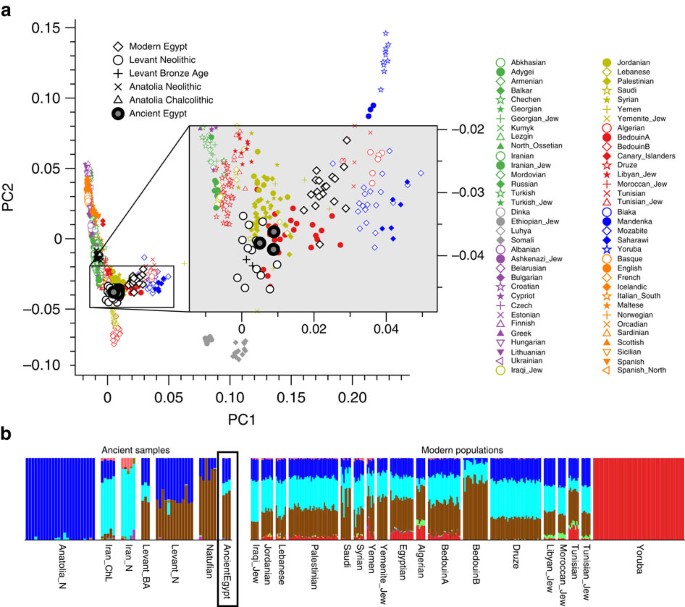 (a) Principal Component Analysis-based genome-wide SNP data of three ancient Egyptians, 2,367 modern individuals and 294 previously published ancient genomes, (b) subset of the full ADMIXTURE analysis (Supplementary Fig. 4).Full size image
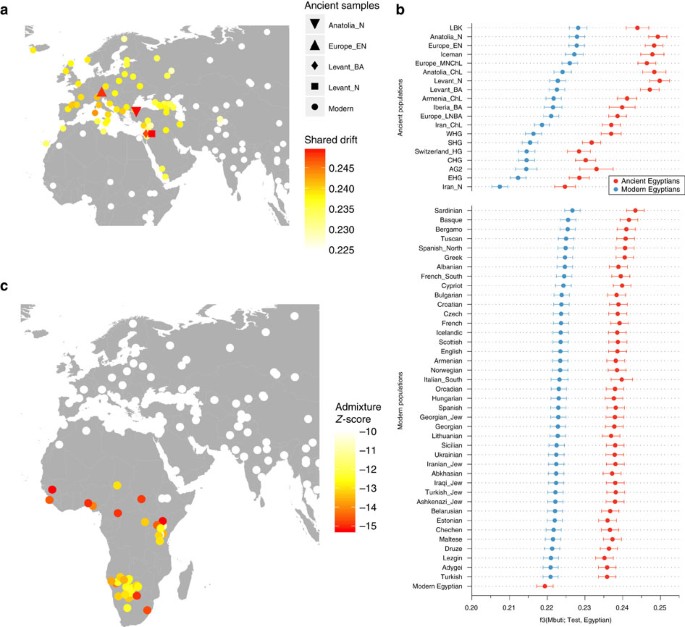 (a) Outgroup f3-statistics measuring shared drift of the three ancient Egyptian samples and other modern and ancient populations, (b) The data shown in a, compared with the same estimates for modern Egyptians, ordered by shared drift with modern Egyptians, (c) Admixture f3-statistics, testing whether modern Egyptians are mixed from ancient Egyptians and some other source. The most negative Z-scores indicate the most likely source populations.Full size image
Finally, we analysed several functionally relevant SNPs in sample JK2911, which had low contamination and relatively high coverage. This individual had a derived allele at the SLC24A5 locus, which contributes to lighter skin pigmentation and was shown to be at high frequency in Neolithic Anatolia41, consistent with the ancestral affinity shown above. Other relevant SNPs carry the ancestral allele, including HERC2 and LCT, which suggest dark-coloured eyes and lactose intolerance (Supplementary Table 9).
This study demonstrates that the challenges of ancient DNA work on Egyptian mummies can be overcome with enrichment strategies followed by high-throughput DNA sequencing. The use of ancient DNA can greatly contribute towards a more accurate and refined understanding of Egypt’s population history. More specifically, it can supplement and serve as a corrective to archaeological and literary data that are often unevenly distributed across time, space and important constituents of social difference (such as gender and class) as well as modern genetic data from contemporary populations that may not be fully representative of past populations.
The archaeological site Abusir el-Meleq was inhabited from at least 3250BCE until about 700CE and was of great religious significance because of its active cult to Osiris, the god of the dead, which made it an attractive burial site for centuries2. Written sources indicate that by the third century BCE Abusir el-Meleq was at the centre of a wider region that comprised the northern part of the Herakleopolites province, and had close ties with the Fayum and the Memphite provinces, involving the transport of wheat, cattle-breeding, bee-keeping and quarrying42. In the early Roman Period, the site appears to have been the main centre in its own district42. Abusir el-Meleq’s proximity to, and close ties with, the Fayum are significant in the context of this study as the Fayum in particular saw a substantial growth in its population during the first hundred years of Ptolemaic rule, presumably as a result of Greek immigration33,43. Later, in the Roman Period, many veterans of the Roman army—who, initially at least, were not Egyptian but people from disparate cultural backgrounds—settled in the Fayum area after the completion of their service, and formed social relations and intermarried with local populations44. Importantly, there is evidence for foreign influence at Abusir el-Meleq. Individuals with Greek, Latin and Hebrew names are known to have lived at the site and several coffins found at the cemetery used Greek portrait image and adapted Greek statue types to suit ‘Egyptian’ burial practices2,45. The site’s first excavator, Otto Rubensohn, also found a Greek grave inscription in stone as well as a writing board inscribed in Greek46. Taken together with the multitude of Greek papyri that were written at the site, this evidence strongly suggests that at least some inhabitants of Abusir el-Meleq were literate in, and able to speak, Greek45. However, a general issue concerning the site is that several details of the context of the individuals analysed in this study were lost over time. All of the material was excavated by Rubensohn in the early twentieth century, whose main interest was to obtain literary papyri from cartonnage rather than to excavate human remains47. As is customary for the time, Rubensohn’s archaeological records are highly incomplete and many of the finds made by him were removed undocumented from their contexts. Furthermore, many of his excavation diaries and notes were destroyed during the Second World War19. This lack of context greatly diminishes the possibility of ‘thick description’ of the analysed individuals, at least in terms of their names, titles and materially expressed identity. However, the finds nevertheless hold much promise for a long-term study of population dynamics in ancient Egypt. Abusir el-Meleq is arguably one of the few sites in Egypt, for which such a vast number of individuals with such an extensive chronological spread are available for ancient DNA analysis. Although we only analysed mummified remains, there is little reason to believe that the burials Rubensohn excavated belonged exclusively to a group of prosperous inhabitants on the basis of the far published references to excavation diaries and Rubensohn’s preliminary reports that permit a basic reconstruction. Rather it seems arguable that the complete spectrum of society is represented, ranging from Late Period priests’ burials that stand out by virtue of their size and contents to simple inhumations that are buried with little to no grave goods2. The widespread mummification treatments in the Ptolemaic and Roman Periods in particular, leading to a decline in standards and costs48 and the generally modest appearance of many burials further supports this assessment.
By comparing ancient individuals from Abusir el-Meleq with modern Egyptian reference populations, we found an influx of sub-Saharan African ancestry after the Roman Period, which corroborates the findings by Henn and colleagues16. Further investigation would be needed to link this influx to particular historic processes. Possible causal factors include increased mobility down the Nile and increased long-distance commerce between sub-Saharan Africa and Egypt49. Trans-Saharan slave trade may have been particularly important as it moved between 6 and 7 million sub-Saharan slaves to Northern Africa over a span of some 1,250 years, reaching its high point in the nineteenth century50. However, we note that all our genetic data were obtained from a single site in Middle Egypt and may not be representative for all of ancient Egypt. It is possible that populations in the south of Egypt were more closely related to those of Nubia and had a higher sub-Saharan genetic component, in which case the argument for an influx of sub-Saharan ancestries after the Roman Period might only be partially valid and have to be nuanced. Throughout Pharaonic history there was intense interaction between Egypt and Nubia, ranging from trade to conquest and colonialism, and there is compelling evidence for ethnic complexity within households with Egyptian men marrying Nubian women and vice versa51,52,53. Clearly, more genetic studies on ancient human remains from southern Egypt and Sudan are needed before apodictic statements can be made.
The ancient DNA data revealed a high level of affinity between the ancient inhabitants of Abusir el-Meleq and modern populations from the Near East and the Levant. This finding is pertinent in the light of the hypotheses advanced by Pagani and colleagues, who estimated that the average proportion of non-African ancestry in Egyptians was 80% and dated the midpoint of this admixture event to around 750 years ago17. Our data seem to indicate close admixture and affinity at a much earlier date, which is unsurprising given the long and complex connections between Egypt and the Middle East. These connections date back to Prehistory and occurred at a variety of scales, including overland and maritime commerce, diplomacy, immigration, invasion and deportation54. Especially from the second millennium BCE onwards, there were intense, historically- and archaeologically documented contacts, including the large-scale immigration of Canaanite populations, known as the Hyksos, into Lower Egypt, whose origins lie in the Middle Bronze Age Levant54.
Our genetic time transect suggests genetic continuity between the Pre-Ptolemaic, Ptolemaic and Roman populations of Abusir el-Meleq, indicating that foreign rule impacted the town’s population only to a very limited degree at the genetic level. It is possible that the genetic impact of Greek and Roman immigration was more pronounced in the north-western Delta and the Fayum, where most Greek and Roman settlement concentrated43,55, or among the higher classes of Egyptian society55. Under Ptolemaic and Roman rule, ethnic descent was crucial to belonging to an elite group and afforded a privileged position in society55. Especially in the Roman Period there may have been significant legal and social incentives to marry within one’s ethnic group, as individuals with Roman citizenship had to marry other Roman citizens to pass on their citizenship. Such policies are likely to have affected the intermarriage of Romans and non-Romans to a degree55. Additional genetic studies on ancient human remains from Egypt are needed with extensive geographical, social and chronological spread in order to expand our current picture in variety, accuracy and detail.
However, our results revise previous scepticism towards the DNA preservation in ancient Egyptian mummies due to climate conditions or mummification procedures8. The methodology presented here opens up promising avenues for future genetic research and can greatly contribute towards a more accurate and refined understanding of Egypt’s population history.
All pre-amplifications steps were carried out in clean room facilities dedicated to ancient DNA work at the University of Tübingen. Before the sampling all samples were UV irradiated for 60 min to reduce modern contamination. In addition, the surface of the bone or tissue samples was removed and the teeth were sampled from inside of the tooth pulp. DNA was extracted from 50 mg bone powder for bone or tooth samples, from 100 mg tissue for soft tissue samples, respectively. A silica purification protocol was applied as described in ref. 56 using the following modifications: the Zymo-Spin V funnels (Zymo Research) were bleached and UV irradiated for 60 min and the total elution volume was raised to 100 μl. Aliquots of 20 μl extract were converted into double-stranded Illumina libraries following a well-established protocol22 and sample specific barcodes were added to both sides of the fragments via amplification22,23. Extraction and library blanks were treated accordingly.
Subsequently, the indexed libraries were amplified using 100 μl reactions for each library containing 5 μl library template, 4 units AccuPrime Taq DNA Polymerase High Fidelity (Invitrogen), 1 unit 10 × AccuPrime buffer (containing dNTPs) and 0.3 μM IS5 and IS6 primers22, and the following thermal profile: 2-min initial denaturation at 94 °C, followed by 4–17 cycles consisting of 30-s denaturation at 94 °C, a 30-s annealing at 60 °C and a 2-min elongation at 68 °C and a 5-min final elongation at 68 °C. The amplified libraries were then purified using the MinElute PCR purification kit (Qiagen, Hilden, Germany), quantified with Agilent 2100 Bioanalyzer DNA 1000 chips and were used for the enrichment of the human mitochondrial DNA.
For the nuclear capture two additional libraries for selected 40 samples using 20 μl extract were created as described above with the addition of a UDG treatment27 (see Supplementary Note 2 for details).
All samples were enriched for human mitochondrial DNA via bead capture hybridization as detailed elsewhere33. After enrichment the libraries were amplified in 100 μl reactions with 15 μl template, 2 units Phusion High Fidelity DNA polymerase, 1 unit 5 × HF buffer, 0.25 mM dNTPs and 0.3 μM IS5 and IS6 primers22, and the following thermal profile: 5-min initial denaturation at 95 °C, followed by 16–23 cycles consisting of 30-s denaturation at 95 °C, a 30-s annealing at 60 °C and a 45-s elongation at 72 °C and a 5-min final elongation at 72 °C. Subsequently, the libraries were purified and quantified as described before and paired-end dual index sequencing was carried out on an Illumina HiSeq 2500 platform by 2 × 100+7+7 cycles following the manufacturer’s protocols for multiplex sequencing (TruSeq PE Cluster Kit v3-cBot-HS).
The resulting FastQ files have been processed using EAGER v1.92 (ref. 57). To achieve improved coverages at both ends of the mitochondrial reference, we used the CircularMapper option in EAGER. All reads with a mapping quality of at least 30 were kept for the subsequent analysis. Duplicate reads have been removed using DeDup v0.9.10, included in the EAGER pipeline. The coverage and statistics calculation has been performed inside the EAGER pipeline and indels have been realigned using RealignerTargetCreator and IndelRealigner from the GATK58. Mitochondrial haplogroups have been determined using HaploGrep 2 (ref. 59). Further details of the analysis parameters can be found in Supplementary Note 3. As can be seen in Supplementary Data 1, we achieved coverages ranging from 11-fold up to 4284-fold on the mitochondrial genome, with an average of 408-fold.
Accompanying measures to limit contamination of the libraries in the laboratory work, in silico analysis has been done in order to authenticate samples and further determine the amount of potential contamination on the mitochondrial level. Negative controls were processed in parallel with samples. The former show no substantial mapping rates and suggest that the amount of DNA introduced during laboratory work could be kept on a minimal level. The authenticity of the samples has been further assessed by applying a number of methods and criteria. MapDamage 2.0 (ref. 60) has been used to evaluate fragment lengths and nucleotide misincorporation patterns of the provided samples, all of which showed levels that are characteristic for ancient DNA13. The degree of mitochondrial DNA contamination as well as contamination estimates based on the deamination patterns have been assessed using schmutzi15, generating consensus sequences of both contaminant and supposedly endogenous DNA simultaneously. Furthermore, only samples with less than 3% estimated contamination based on deamination and degree of mitochondrial contamination have been used for further downstream analysis. We furthermore determined whether there are inconsistencies between our haplogroup assignments of the mitochondrial and the nuclear capture respectively, but did not find any (see Supplementary Data 3 for details). As can be seen in Supplementary Table 1, our samples showed damage on both 3′ and 5′ ends of reads in the range of 5% up to 49%, with an average of 14%. Furthermore, the contamination estimation methods showed very low levels of contamination after comparison to a database of putative contaminants, as provided by the used method schmutzi. For all samples, the observed contamination estimates prove to be less than our defined threshold of 3%, except for three samples (JK2879, JK2883, JK2896) where a visual inspection of sequence assemblies was done as described in Posth et al.61 to identify potential contaminating lineages and ensure consistency of the generated consensus mitochondrial genome. As an additional measure, we used the built-in feature ‘log2fasta’ of the tool schmutzi to only incorporate bases in our final consensus sequence with a significant likelihood to be non-contaminated as defined by the method itself. In order to do this, we applied several quality thresholds (q=0,20,40,80) in our analysis and used a moderate filtering value that did not change our consensus sequence to undefined positions to a larger extent. We ultimately chose a value of q=20 for filtering with ‘log2fasta’, but even more strict filtering with q=40 preserved our haplotyping calls to be consistent. However, filtering even stricter introduced more undefined positions (‘N’) due to missing support, potentially hindering sequence-based analysis more dramatically than our frequency-based analysis, which is why we kept a quality threshold of q=20, following cutoffs that other authors have been using, too61.
The non-UDG and UDG treated libraries were enriched by hybridization to probes targeting approximately 1.24 million genomic SNPs as described previously25. The target SNPs consist of panels 1 and 2 as described in Mathieson et al.41 and Fu et al.26 (see Supplementary Note 2 for details).
For each of the 40 samples, we sequenced two captured libraries: one with enzymatic damage repair (UDG), one without (non-UDG). For all samples, we used the EAGER pipeline version 1.92.15 (ref. 57), with default parameters, and with the option to keep only merged reads. We determined the sex of each sample by obtaining the average coverage on X chromosome, Y chromosome and autosomal SNPs in the capture pool using a custom script. We flagged samples as ‘male’ when the ratio of X and autosomal coverage was lower or equal than 0.75 and the ratio of Y and autosomal coverage was greater or equal than 0.25. We flagged samples as ‘female’ when the ratio of X and autosomal coverage was greater than 0.75 and the ratio of Y and autosomal coverage was lower than 0.25. For all male samples that had at least a total number of 150 SNPs on chromosome X covered twice, we obtained contamination estimates using the ANGSD software62, using the ‘MoM’ estimate from ‘Method 1’ and the ‘new_llh’ likelihood computation. Supplementary Data 2 summarizes all these results. In some cases, ANGSD finished with an error, as indicated in the table. Entries with ‘n/a’ are either female or have insufficient coverage on the X chromosome.
Three samples were selected for down-stream analysis: JK2134, JK2888 and JK2911. In all three of these samples, contamination estimates were acceptable, and similar in both UDG and non-UDG libraries as can be seen in Supplementary Data 2. Furthermore, in all three samples the non-UDG library showed DNA damage over 8% in the first base pair of reads, which is within the expected range of damage for ancient DNA of this age.
We called genotypes from the UDG treated data for the three individuals by sampling a random read per SNP in the SNP-capture panel, using a custom tool ‘pileupCaller’, available at https://github.com/stschiff/sequenceTools. The resulting genotypes were merged with data from two other data sets: First, 2,367 modern individuals genotyped on the Affymetrix Human Origins Array34,35; second, 294 ancient genomes36.
We used the ADMIXTURE software on the merged data set to cluster ancestry proportions using different numbers of clusters37. The lowest cross-validation error was obtained using K=16 and we show the results of that run in Supplementary Fig. 4. A subset is shown in Fig. 4b.
We performed PCA on the joined data set using the ‘smartpca’ software from the Eigensoft package63. For the plot shown in Supplementary Fig. 3, we used a selected set of European populations as shown in Supplementary Note 2.
We used the ‘qp3pop’ tool from the Admixtools package39 to compute Outgroup f3-statistics of the form f3(Mbuti; Egyptian, X), where ‘Egyptian’ means either ancient and modern Egyptian, and ‘X’ runs over all populations in the merged data set. For the plot in Fig. 5b, we ordered all results based on the result using the modern Egyptian samples and show the top hits. For the map plot in Fig. 5a we placed all modern populations on their sampling locations obtained from Lazaridis et al.34, and added selected ancient populations that stood out from the background, as shown in Figure 5b. We then used the ‘qp3pop’ tool to compute f3-statistics of the form f3(Egyptian; Ancient Egypt, X), where X runs over all populations in the merged data set. Fig. 5c shows a similar plot as in Fig. 5a, but with the colour code indicating the Z score for this latter f3-statistics, where a negative Z score indicates a probable source for admixture.
Since two of the three selected samples had contamination rate estimates over 5%, we repeated this analysis using only sample JK2911, which has the highest SNP coverage and a contamination estimate of below 1%. The result is shown in Supplementary Fig. 5, with very similar results as when using all three samples, indicating no effect of contamination on our results.
In order to detect genetic similarities or distances between our three ancient Egyptian populations (n=90) and present-day populations (see Supplementary Note 4), we collated a data set of Egyptian (n=135) and Ethiopian (n=120) mtDNA sequences from the literature for the respective area in upper Egypt, the El-Hayez oasis30 and Ethiopia17. We calculated genetic distances (FST) based on the full mtDNA of these individuals. FST values were calculated using Arlequin v3.5.2.2 (ref. 28), applying the Tamura and Nei substitution model64 and a respective gamma value of 0.260. To determine the most suitable parameter set and substitution method, we used jModelTest v2.1.10 (ref. 65) and selected the parameters suggested by the Akaike and Bayesian information criterion (AIC and BIC). P values for the calculated FST values were corrected for multiple comparisons to minimize the probability of type I errors (false positives) using the Benjamini–Hochberg method66, a false discovery rate-based method implemented in the p.adjust function in R 3.2.3 (The R Project for Statistical Computing 2011, https://www.r-project.org/). We split our individuals in three groups (Pre-Ptolemaic, Ptolemaic and Roman Period) based on the 14C dates obtained from the samples (Supplementary Data 1). However, as the intra-group distances of our three ancient populations were not significantly different from each other, we merged all three ancient populations in a single set to perform FST analyses between modern populations and the ancient meta population with more statistical power than keeping the individual populations separate. Our results can be found in Supplementary Table 2.
To determine the relationships between our ancient samples from the Pre-Ptolemaic, Ptolemaic and Roman time periods in contrast to modern populations in the respective areas, we performed a multi-d

On October 20, the American Society of Human Genetics held its annual meeting, and the conclusions they reached can easily be described as astonishing.

You can purchase signed books,The Royal Dragon Court Inbred Britain by Abbe de Vere and Transylvania To Tunbridge Wells by Nicholas De Vere on our shop THE ROYAL DRAGON COURT BOOKS page, Grab your copy HERE